A Strong Jobs Market Lends Itself to Consumer Spending
A Strong Jobs Market Lends Itself to Consumer Spending
When we at SmartTrust® discuss the current state of the jobs market in the U.S., it is always important to reiterate that there are many different measures of unemployment (or employment) and understanding the differences in each measure can be helpful in gaining a full understanding of the complete employment picture.
The three key labor market statistics that we generally review in order to assess the current state of employment in the United States are as follows (recognizing that we regularly review private sector job creations data as well):
1. U3 Unemployment Rate – the most commonly referred to “official” rate of unemployment, the U3 unemployment rate measures the proportion of the civilian labor force that is unemployed but actively seeking employment.
2. U6 Unemployment Rate – the U6 unemployment rate counts not only people without work seeking full-time employment (the more quoted U-3 rate), but also counts marginally attached workers and those working part-time for economic reasons.
3. Initial Jobless Claims – a weekly measure by the U.S. Department of Labor that shows the number of initial jobless claims filed by individuals seeking to receive jobless benefits.
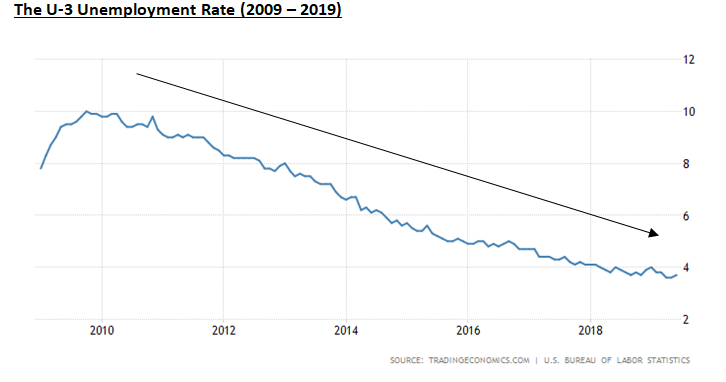
As of June 2019, the U3 (i.e. the “official”) unemployment rate stood at 3.7%, just above the May reading of 3.6%, the latter of which represented a 49 year low for this unemployment indicator. To put this statistic into a historical context, the unemployment rate in the United States averaged 5.76% from 1948 until 2019, reaching an all-time high of 10.80% in November of 1982 and a record low of 2.50 percent in May of 1953. Additionally, following the Great Recession of 2008-2009, the U-3 unemployment rate hit a high of 10% in October of 2009.

The more encompassing U-6 unemployment rate registered 7.2% in June of 2019. During the Great Recession of 2008-2009, the U-6 unemployment rate hit a high of 17.1% during various months in 2009 and 2010.
In terms of initial jobless claims, for the week ending July 6, 2019, seasonally adjusted initial claims totaled 209,000; marking a 3 month low, versus a consensus estimate of 221,000 jobless claims.
A review of these three employment data points paints a clear picture of a strong and stable jobs market. A robust jobs market, coupled with moderately rising wages, bodes well for high levels of consumer confidence, leading to potentially strong levels of consumer spending. This is important as consumer spending still accounts for approximately 70% of gross domestic product (GDP) in the United States. In this regard, according to Capital Economics, underlying retail sales posted their strongest quarterly gain during the 2nd quarter of 2019 since 2005.
———————————————————————————————————————
Disclosure: Hennion & Walsh Asset Management currently has allocations within its managed money program and Hennion & Walsh currently has allocations within certain SmartTrust® Unit Investment Trusts (UITs) consistent with several of the portfolio management ideas for consideration cited above.


