Putting Closed-end Fund Discounts into Perspective
I often hear from advisors that one of their primary selection criteria for closed-end funds (CEFs) is whether or not the CEF in question is trading at a discount or premium to its current net asset value (NAV). I then often follow-up with these advisors by asking them why this is so important to them and the answer that I generally hear back is that they are looking for good value, or a discount, and are uncomfortable paying a premium for anything. I appreciate that most people, in general, are always looking for a good bargain and that people are typically averse to paying more for something than it is worth. However, I don’t think that these adages necessarily apply to CEFs and relying too much on whether or not a CEF is trading at a discount to its given NAV may result in poor investment decisions.
Perhaps the confusion amongst advisors stems from their experience with debt issuances that have a defined maturity date (or call dates in some cases) where the par value of the issue is ultimately returned to the investor. Hence, a bond bought at a premium will “pull back to par” as it gets closer to maturity and a bond bought at a discount will “push up to par” as it gets closer to maturity. This is not the case with CEFs however. There are no maturity dates (or known call dates) with CEFs and I have yet to see a rule that suggests that a CEF has to ever trade at its NAV after inception date. Hence, the mere fact that a CEF is trading at a discount to its NAV does not indicate that it is a bargain nor does a CEF trading at a premium to its NAV suggest that it is expensive or overvalued. It is also fair to point out that CEFs do not always trade rationally in accordance with their NAV and may experience more price volatility in the secondary market for a variety of reasons.
With this said, I do take into consideration where a CEF is trading relative to its NAV as part of our general CEF screening process at SmartTrust® and do consider certain premium trading levels to be so high that they are typically excluded from further consideration. However, when looking at the current price/NAV relationship, I believe that it is more important to review this data in the following context:
• Current Price/NAV relationship versus peers in their respective category
• Current Price/NAV relationship relative to 52 week average (and longer if available)
• Current Price/NAV relationship relative to 52 week high (and longer if available)
• Current Price/NAV relationship relative to 52 week low (and longer if available)
Looking at a couple of the historical, category price/NAV relationships shown below should help to underscore the rationale behind the need to review this information on a relative basis as opposed to just looking at a CEF’s current discount or premium level and making a snap judgment.
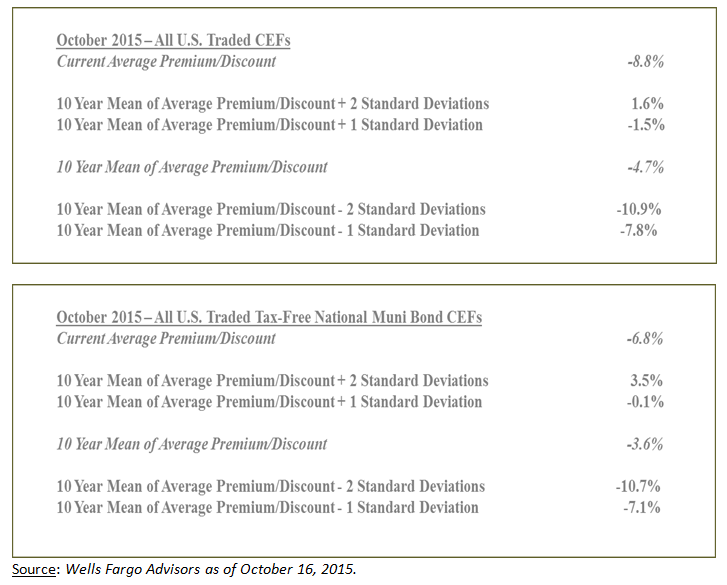
For example, if a given CEF were trading at a discount to its NAV of 3%, some advisors may initially consider this CEF to be of value as it is “on sale.” However, looking at this discount on a relative basis may lend itself to a different conclusion. Consider that as of October 16, 2015, the 10-year mean average premium/discount for all CEFs is -4.7%. Consider also that as of this same date, the current average premium/discount of all CEF is -8.8%. All of a sudden, the 3% discount of the CEF in question does not potentially look to be as “on sale” as it did prior to putting its discount into a relative perspective. This does not mean that the CEF should not be considered as the discount may be attractive relative to its category peers, its own 52 week average premium/discount and/or have other characteristics that would make the selection of the CEF appropriate for a given investment objective. For these reasons, I also believe that it is important to review other data points to assess the value of a given CEF investment strategy including, but not limited to, the following:
• Total Assets
• Current Earnings/Distribution Ratio
• Undistributed Net Investment Income (UNII) Balance
• Type and Amount of Leverage
• Distribution Yield (as well as Frequency and Nature of Distributions)
• Average Trading Volume
• NAV and Price Performance relative to Category Peers
• Duration and Average Credit Quality (as applicable)
• % Of Callable Bonds and % AMT (as applicable)
• Expense Ratio
As with other product types, CEFs have their own unique set of risks that we should be researched and understood before making any investment decision.
Disclosure: Hennion & Walsh is the sponsor of SmartTrust® Unit Investment Trusts (UITs). For more information on SmartTrust® UITs, please visit www.smarttrustuit.com. The overview above is for informational purposes and is not an offer to sell or a solicitation of an offer to buy any SmartTrust® UITs. Investors should consider the Trust’s investment objective, risks, charges and expenses carefully before investing. The prospectus contains this and other information relevant to an investment in the Trust and investors should read the prospectus carefully before they invest.