Additional Volatility Likely but Opportunities Remain
Market Overview
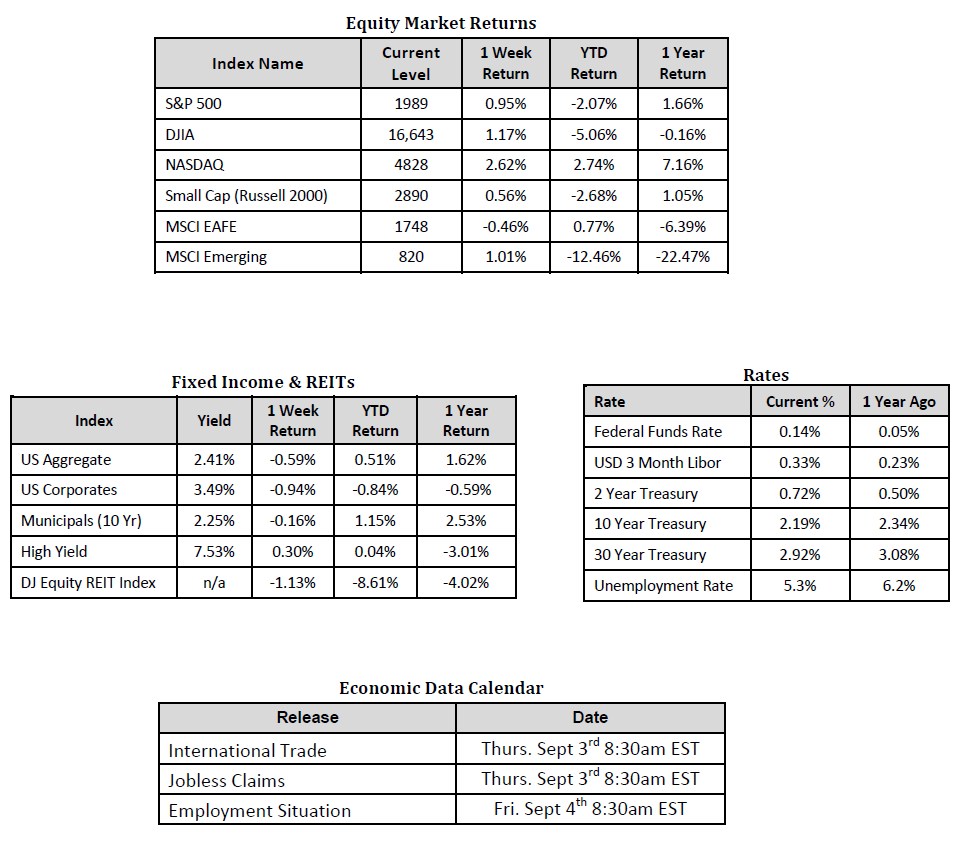
Sources: Equity Market, Fixed Income and REIT returns from JP Morgan as of 8/28/15. Rates and Economic Calendar Data from Bloomberg as of 8/31/15.
Happening Now
Despite last Monday’s 1,000 point intraday drop, U.S. stock markets actually finished the last full week of August in positive territory with the Dow Jones Industrial Average (DJIA) gaining 1.2% and the S&P 500 Index advancing 0.95%. Through the end of August, however, these two indices are down 5.7% and 2.9% for the year respectively. The volatility that we have witnessed in the markets since China announced the devaluation of the Yuan/Remninbi on Wednesday August 19, is not likely to be over in the short term given several headwinds that lie ahead for the markets. These headwinds include institutional trading behavior, uncertainty around Fed policy, and technical indicators.
As we understanding it, certain institutional investors have mandates that require them to maintain a specific level of volatility in the portfolios that they manage, forcing them to reduce their exposure to equities, regardless of the price they are selling for, in certain trading environments. Whether or not the Federal Reserve decides to raise interest rates in September also appears to be weighing on investor sentiment – at least to the degree that it presents yet another area of uncertainty. Allianz economist, Mohammed El Arian, wrote on Bloomberg of Fed Policy:
“…though policy makers are still eager to curtail spikes in market volatility, they already have expended a lot of ammunition via quantitative easing, floored interest rates and other unconventional policies. As a result, the series of monetary policy actions in China and the calming remarks from N.Y. Fed President Bill Dudley last week could soon be tested by developments on the ground.”
Technical traders may also add downside pressure to stock prices with the S&P 500 index breaking below the 200 day moving average with some models based on technical analysis suggesting an extended period of lower prices. Oppenheimer’s technical analyst, Ari Wald, suggested on Bloomberg markets that this correction looks similar to the one in 2011 and prices may remain at these levels for weeks, if not months, until they stabilize and regain an upward trend.
Despite the increase in volatility, the fundamentals of the U.S. economy suggest this is not the end of what we at SmartTrust® believe is a secular bull market for stocks. Consider the table below which summarizes the economic data that has been released since last Monday:
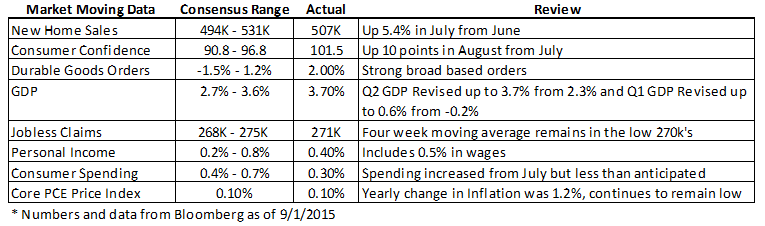
Four of the releases were in line with positive expectations, three beat expectations- including GDP which was a solid 3.7% for the second quarter of 2015 and revised upward to a positive 0.6% for Q1 2015. The only release to underperform expectations was the consumer spending which registered growth of 0.3% over the month prior while expectations were for a gain of up to 0.7%.
The recent swings in stock market prices should serve as a reminder to investors that building and maintaining diversified portfolios are critical towards long term growth potential. Recognizing that not all market recoveries are the same, consider that before the financial crises investors who held 60% stocks and 40% bonds when the market peaked in October 2007 (as measured by the S&P 500 index) gained their losses back almost a year and a half earlier than those who just held U.S. stocks. We encourage investors to take this opportunity to re-evaluate their risk tolerance and asset allocation strategy to ensure they are positioned to achieve their long term objectives.
Important Information and Disclaimers
Disclosures: Past performance does not guarantee future results. We have taken this information from sources that we believe to be reliable and accurate. Hennion and Walsh cannot guarantee the accuracy of said information and cannot be held liable.
Investing in foreign securities presents certain risks not associated with domestic investments, such as currency fluctuation, political and economic instability, and different accounting standards. This may result in greater share price volatility. These risks are heightened in emerging markets.
There are special risks associated with an investment in real estate, including credit risk, interest rate fluctuations and the impact of varied economic conditions. Distributions from REIT investments are taxed at the owner’s tax bracket.
The prices of small company and mid cap stocks are generally more volatile than large company stocks. They often involve higher risks because smaller companies may lack the management expertise, financial resources, product diversification and competitive strengths to endure adverse economic conditions.
Investing in commodities is not suitable for all investors. Exposure to the commodities markets may subject an investment to greater share price volatility than an investment in traditional equity or debt securities. Investments in commodities may be affected by changes in overall market movements, commodity index volatility, changes in interest rates or factors affecting a particular industry or commodity.
Products that invest in commodities may employ more complex strategies which may expose investors to additional risks.
Investing in fixed income securities involves certain risks such as market risk if sold prior to maturity and credit risk especially if investing in high yield bonds, which have lower ratings and are subject to greater volatility. All fixed income investments may be worth less than original cost upon redemption or maturity. Bond Prices fluctuate inversely to changes in interest rates. Therefore, a general rise in interest rates can result in the decline of the value of your investment.
Definitions
MSCI- EAFE: The Morgan Stanley Capital International Europe, Australasia and Far East Index, a free float-adjusted market capitalization index that is designed to measure developed-market equity performance, excluding the United States and Canada.
MSCI-Emerging Markets: The Morgan Stanley Capital International Emerging Market Index, is a free float-adjusted market capitalization index that is designed to measure the performance of global emerging markets of about 25 emerging economies.
Russell 3000: The Russell 3000 measures the performance of the 3000 largest US companies based on total market capitalization and represents about 98% of the investible US Equity market.
ML BOFA US Corp Mstr [Merill Lynch US Corporate Master]: The Merrill Lynch Corporate Master Market Index is a statistical composite tracking the performance of the entire US corporate bond market over time.
ML Muni Master [Merill Lynch US Corporate Master]: The Merrill Lynch Municipal Bond Master Index is a broad measure of the municipal fixed income market.
Investors cannot directly purchase any index.
LIBOR, London Interbank Offered Rate, is the rate of interest at which banks offer to lend money to one another in the wholesale money markets in London.
The Dow Jones Industrial Average is an unweighted index of 30 “blue-chip” industrial U.S. stocks.
The S&P Midcap 400 Index is a capitalization-weighted index measuring the performance of the mid-range sector of the U.S. stock market, and represents approximately 7% of the total market value of U.S. equities. Companies in the Index fall between S&P 500 Index and the S&P SmallCap 600 Index in size: between $1-4 billion.
DJ Equity REIT Index represents all publicly traded real estate investment trusts in the Dow Jones U.S. stock universe classified as Equity REITs according to the S&P Dow Jones Indices REIT Industry Classification Hierarchy. These companies are REITSs that primarily own and operate income-producing real estate.