All Eyes on the Federal Reserve
Market Overview
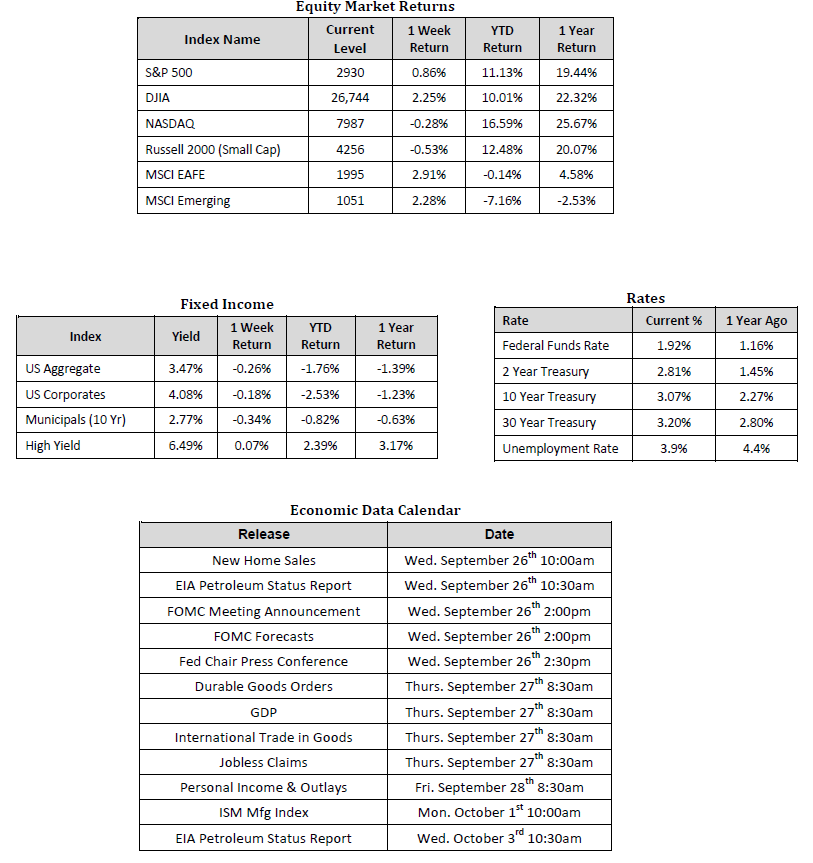 Sources: Sources for data in tables: Equity Market and Fixed Income returns are from JP Morngan as of 09/21/18. Rates and Economic Calendar Data from Bloomberg as of 09/24/18. International developed markets measured by the MSCI EAFE Index, emerging markets measured by the MSCI EM Index. Sector performance is measured using GICS methodology.
Happening Now
Major Averages across the globe were generally higher last week. In the U.S., the S&P 500 Index and Dow Jones Industrial Average reached record highs and finished the week up 0.86% and 2.25% respectively. Financials, Materials, and Energy sectors led the way in the S&P 500. On the other hand, the tech heavy NASDAQ Index and the Russell 2000 Small Cap Index lagged, returning -0.28% and -0.53% respectively for the week. Overseas, developed markets and emerging markets notched solid returns of 2.91% and 2.28% respectively, as measured by the MSCI EAFE and MSCI Emerging Market Indices. It appears that investors were able look past the continued trade and tariff banter between the U.S. and China, perhaps until something more concrete is in place. Bond yields also climbed ahead of this week’s Federal Open Market Committee (FOMC) meeting.
Speaking of the Federal Reserve (Fed), their September meeting kicks-off today and they are widely expected to increase the benchmark rate for the third time this year. In fact, according to the CME Group, Fed Funds futures are currently predicting a 79.2% chance of a fourth rate hike this year. Although the third rate hike of 25 basis points seems to be all but inevitable, investors will be paying closer attention to the post meeting release on Wednesday for any indications of future rate trajectory, including the potential for yet another hike in December.
While it is important to monitor the path of interest rates and the potential impacts on our economy, and in turn the capital markets, we believe investors can still find opportunities domestically and abroad as the bull market cycle continues. In the U.S., consumer confidence is high and households are spending, corporate earnings continue to grow, and interest rates are still relatively low from a historical standpoint. Overseas, of course depending on the region, we see plenty of signs of optimism and even potential investment opportunities in areas that may have been depressed this year more than they should have based on their fundamentals. For example, although European earnings are still below pre-crisis levels, analyst consensus now expects European earnings-per-share (EPS) to grow at a similar rate to the rest of the developed world – at around 10% – in 2019. In addition, consumer confidence in Europe remains at a two decade high and M&A deals are increasing significantly.
With all of this understood, we encourage investors to stay disciplined and work with an experienced financial professional to help manage their portfolio through various market cycles within a well-diversified framework that is consistent with their objectives, time-frame and tolerance for risk.
Important Information and Disclaimers
Disclosures: Hennion & Walsh is the sponsor of SmartTrust® Unit Investment Trusts (UITs). For more information on SmartTrust® UITs, please visit www.smarttrustuit.com. The overview above is for informational purposes and is not an offer to sell or a solicitation of an offer to buy any SmartTrust® UITs. Investors should consider the Trust’s investment objective, risks, charges and expenses carefully before investing. The prospectus contains this and other information relevant to an investment in the Trust and investors should read the prospectus carefully before they invest.
Investing in foreign securities presents certain risks not associated with domestic investments, such as currency fluctuation, political and economic instability, and different accounting standards. This may result in greater share price volatility. These risks are heightened in emerging markets.
There are special risks associated with an investment in real estate, including credit risk, interest rate fluctuations and the impact of varied economic conditions. Distributions from REIT investments are taxed at the owner’s tax bracket.
The prices of small company and mid cap stocks are generally more volatile than large company stocks. They often involve higher risks because smaller companies may lack the management expertise, financial resources, product diversification and competitive strengths to endure adverse economic conditions.
Investing in commodities is not suitable for all investors. Exposure to the commodities markets may subject an investment to greater share price volatility than an investment in traditional equity or debt securities. Investments in commodities may be affected by changes in overall market movements, commodity index volatility, changes in interest rates or factors affecting a particular industry or commodity.
Products that invest in commodities may employ more complex strategies which may expose investors to additional risks.
Investing in fixed income securities involves certain risks such as market risk if sold prior to maturity and credit risk especially if investing in high yield bonds, which have lower ratings and are subject to greater volatility. All fixed income investments may be worth less than original cost upon redemption or maturity. Bond Prices fluctuate inversely to changes in interest rates. Therefore, a general rise in interest rates can result in the decline of the value of your investment.
Definitions
MSCI- EAFE: The Morgan Stanley Capital International Europe, Australasia and Far East Index, a free float-adjusted market capitalization index that is designed to measure developed-market equity performance, excluding the United States and Canada.
MSCI-Emerging Markets: The Morgan Stanley Capital International Emerging Market Index, is a free float-adjusted market capitalization index that is designed to measure the performance of global emerging markets of about 25 emerging economies.
Russell 3000: The Russell 3000 measures the performance of the 3000 largest US companies based on total market capitalization and represents about 98% of the investible US Equity market.
ML BOFA US Corp Mstr [Merill Lynch US Corporate Master]: The Merrill Lynch Corporate Master Market Index is a statistical composite tracking the performance of the entire US corporate bond market over time.
ML Muni Master [Merill Lynch US Corporate Master]: The Merrill Lynch Municipal Bond Master Index is a broad measure of the municipal fixed income market.
Investors cannot directly purchase any index.
LIBOR, London Interbank Offered Rate, is the rate of interest at which banks offer to lend money to one another in the wholesale money markets in London.
The Dow Jones Industrial Average is an unweighted index of 30 “blue-chip” industrial U.S. stocks.
The S&P Midcap 400 Index is a capitalization-weighted index measuring the performance of the mid-range sector of the U.S. stock market, and represents approximately 7% of the total market value of U.S. equities. Companies in the Index fall between S&P 500 Index and the S&P SmallCap 600 Index in size: between $1-4 billion.
DJ Equity REIT Index represents all publicly traded real estate investment trusts in the Dow Jones U.S. stock universe classified as Equity REITs according to the S&P Dow Jones Indices REIT Industry Classification Hierarchy. These companies are REITs that primarily own and operate income-producing real estate.