
Capital Markets Update – Week of 2/2/2015
Market Overview
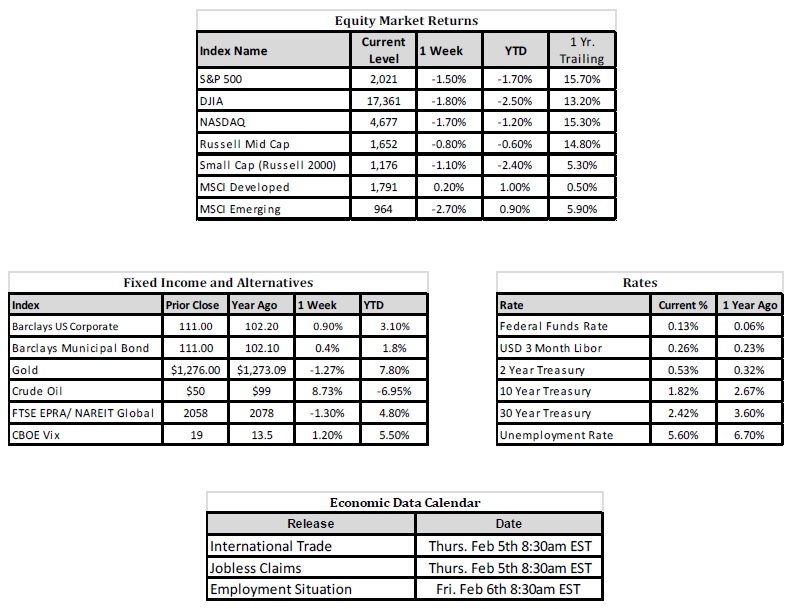
Sources: Rates Data and Economic Calendar—Bloomberg Markets as of 2/3/15; Equity Market Returns and Fixed Income and Alternatives Data—Wells Fargo Advisers as of 2/2/15.
Happening Now
Asset Class Returns Looking Similar to 2014
The month of January finished with negative results in equity markets as volatility returned and a flight to quality was exhibited. As of the end of the month, the S&P 500 lost 3%, Fixed Income indexes on average returned close to 2% in both taxable and tax exempt securities and commodity markets showed mixed returns. Oil continued its sell-off and fell over 12% while gold gained close to 9% as investors globally, looked for ways to hedge currency fluctuations in the face of low inflation and a further strengthening dollar.
When forming our 2015 forecasts, we concluded that full year asset class returns will likely produce similar returns as they did in 2014, albeit with increased volatility and marginally lower total returns in equities. Looking back on January, asset classes look to be moving in the same direction this year as they did to start 2014. Using ETFs to show the return a US investor could have realized, we organized a table comparing twelve broad asset classes and their January 2015 and 2014 returns respectively:
| January Market Returns | |||
| Asset Class | 2015 | 2014 | ETF Ticker Used |
| S&P 500 | -3.0% | -3.5% | SPY |
| Russell 2000 | -3.3% | -2.8% | IWM |
| S&P Mid Cap 400 | -2.9% | -1.7% | IJJ |
| Nasdaq | -2.1% | -1.9% | QQQ |
| Barclay’s Agg | 2.1% | 1.5% | AGG |
| Barclay’s Muni | 2.1% | 2.6% | TFI |
| MSCI ACWI (USD) | -1.3% | -4.6% | ACWI |
| MSCI EM (USD) | -0.7% | -8.6% | EEM |
| Oil (WTI) | -12.5% | -1.5% | USO |
| Gold | 8.7% | 3.4% | GLD |
| REITs | 6.6% | 3.9% | RWR |
| VIX | 17.0% | 16.4% | VXX |
| *Returns from Morningstar as of 2/3/15. Past performance is not a guarantee of future results. | |||
As you can see from the chart above, there is significant directional consistency across all twelve of the asset classes, though the magnitude of the difference in directionally consistent returns is significant in some asset classes (ex. Oil). Recognizing that the markets are facing a different economic and geopolitical environment this year, we don’t expect an exact replication of 2014 returns. However, we are optimistic that the U.S. economy will continue to outpace many developed international countries to the benefit of U.S. equity investors.
Important Information and Disclaimers
Past Performance is not a guarantee of future performance.
Investing in foreign securities presents certain risks not associated with domestic investments, such as currency fluctuation, political and economic instability, and different accounting standards. This may result in greater share price volatility. These risks are heightened in emerging markets.
There are special risks associated with an investment in real estate, including credit risk, interest rate fluctuations and the impact of varied economic conditions. Distributions from REIT investments are taxed at the owner’s tax bracket.
The prices of small company and mid cap stocks are generally more volatile than large company stocks. They often involve higher risks because smaller companies may lack the management expertise, financial resources, product diversification and competitive strengths to endure adverse economic conditions.
Investing in commodities is not suitable for all investors. Exposure to the commodities markets may subject an investment to greater share price volatility than an investment in traditional equity or debt securities. Investments in commodities may be affected by changes in overall market movements, commodity index volatility, changes in interest rates or factors affecting a particular industry or commodity.
Products that invest in commodities may employ more complex strategies which may expose investors to additional risks.
Investing in fixed income securities involves certain risks such as market risk if sold prior to maturity and credit risk especially if investing in high yield bonds, which have lower ratings and are subject to greater volatility. All fixed income investments may be worth less than original cost upon redemption or maturity. Bond Prices fluctuate inversely to changes in interest rates. Therefore, a general rise in interest rates can result in the decline of the value of your investment.
Definitions
MSCI- EAFE: The Morgan Stanley Capital International Europe, Australasia and Far East Index, a free float-adjusted market capitalization index that is designed to measure developed-market equity performance, excluding the United States and Canada.
MSCI-Emerging Markets: The Morgan Stanley Capital International Emerging Market Index, is a free float-adjusted market capitalization index that is designed to measure the performance of global emerging markets of about 25 emerging economies.
Russell 3000: The Russell 3000 measures the performance of the 3000 largest US companies based on total market capitalization and represents about 98% of the investible US Equity market.
ML BOFA US Corp Mstr [Merill Lynch US Corporate Master]: The Merrill Lynch Corporate Master Market Index is a statistical composite tracking the performance of the entire US corporate bond market over time.
ML Muni Master [Merill Lynch US Corporate Master]: The Merrill Lynch Municipal Bond Master Index is a broad measure of the municipal fixed income market.
Investors cannot directly purchase any index.
LIBOR, London Interbank Offered Rate, is the rate of interest at which banks offer to lend money to one another in the wholesale money markets in London.
The Dow Jones Industrial Average is an unweighted index of 30 “blue-chip” industrial U.S. stocks.
The S&P Midcap 400 Index is a capitalization-weighted index measuring the performance of the mid-range sector of the U.S. stock market, and represents approximately 7% of the total market value of U.S. equities. Companies in the Index fall between S&P 500 Index and the S&P SmallCap 600 Index in size: between $1-4 billion.
DJ Equity REIT Index represents all publicly traded real estate investment trusts in the Dow Jones U.S. stock universe classified as Equity REITs according to the S&P Dow Jones Indices REIT Industry Classification Hierarchy. These companies are REITSs that primarily own and operate income-producing real estate.