Big Tech Pushes Markets to New Highs as Inflation Data Looms
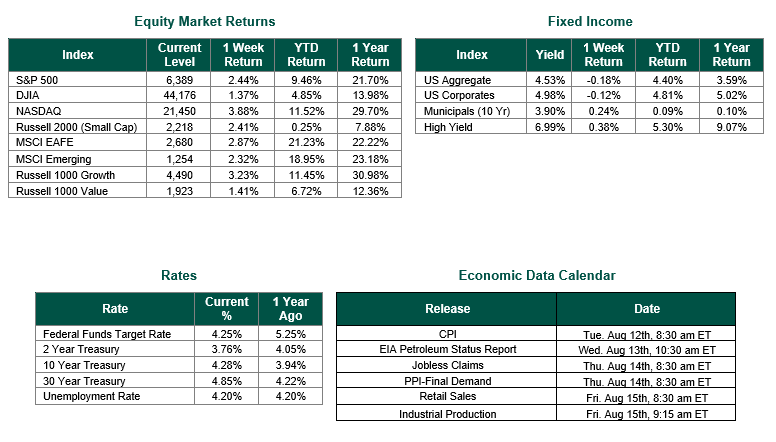
Global equity markets finished higher for the week. In the U.S., the S&P 500 Index closed the week at a level of 6,389, representing a gain of 2.44%, while the Russell Midcap Index moved -0.29% last week. Meanwhile, the Russell 2000 Index, a measure of the Nation’s smallest publicly traded firms, returned 2.41% over the week. As developed international equity performance and emerging markets were positive, returning 2.87% and 2.32%, respectively. Finally, the 10-year U.S. Treasury yield moved higher, closing the week at 4.28%
A flurry of economic data releases painted a mixed picture of the U.S. economy last week, prompting volatile reactions across financial markets. The Bureau of Economic Analysis (BEA) reported that second-quarter gross domestic product (GDP) grew at an annualized rate of 3.0%, driven primarily by consumer spending and a sharp decline in imports, which reversed a tariff-induced surge from Q1. However, investment contracted by 15.6%, raising concerns about business confidence amid trade and tariff policy uncertainty.
The Nasdaq Composite reached a new all-time high on Thursday, August 7th, closing at 21,450.02 after a 1% gain. This performance was largely fueled by a rally in semiconductor stocks and renewed investor enthusiasm for mega-cap tech companies. The catalyst came from a policy announcement by the Trump Administration, which declared that companies committing to U.S.-based manufacturing would be exempt from newly imposed 100% tariffs on chip imports. This announcement sent shares of major chipmakers soaring. Apple also played a starring role, climbing more than 3% after announcing a $100 billion investment in U.S. manufacturing, building on a 5% surge the day before. The broader tech sector benefited from hopes of future interest rate cuts, which tend to favor growth stocks.
Looking ahead to this week, several major U.S. economic data releases are scheduled that could influence market sentiment. On Tuesday, the Consumer Price Index (CPI) for July will be released, with forecasts pointing to a 0.2% month-over-month increase and a 2.7% rise year-over-year. On Thursday, the Producer Price Index (PPI) for July is due, offering insight into wholesale price trends, with core PPI projected to rise 0.1% month-over-month. The week wraps up on Friday with July’s Retail Sales report, expected to show a 0.4% monthly increase, suggesting steady consumer spending despite inflation concerns.
Best wishes for the week ahead!
Equity and Fixed Income Index returns sourced from Bloomberg on 8/8/25. Both GDP data were sourced from the Bureau of Economic Analysis. Economic Calendar Data from Econoday as of 8/8/25. International developed markets are measured by the MSCI EAFE Index, emerging markets are measured by the MSCI EM Index, and U.S. Large Caps are defined by the S&P 500 Index. Sector performance is measured using the GICS methodology.
Disclosures: Past performance does not guarantee future results. We have taken this information from sources that we believe to be reliable and accurate. Hennion and Walsh cannot guarantee the accuracy of said information and cannot be held liable. You cannot invest directly in an index. Diversification can help mitigate the risk and volatility in your portfolio but does not ensure a profit or guarantee against a loss.