Earnings and Jobs Data Paint Optimistic Picture
Market Overview
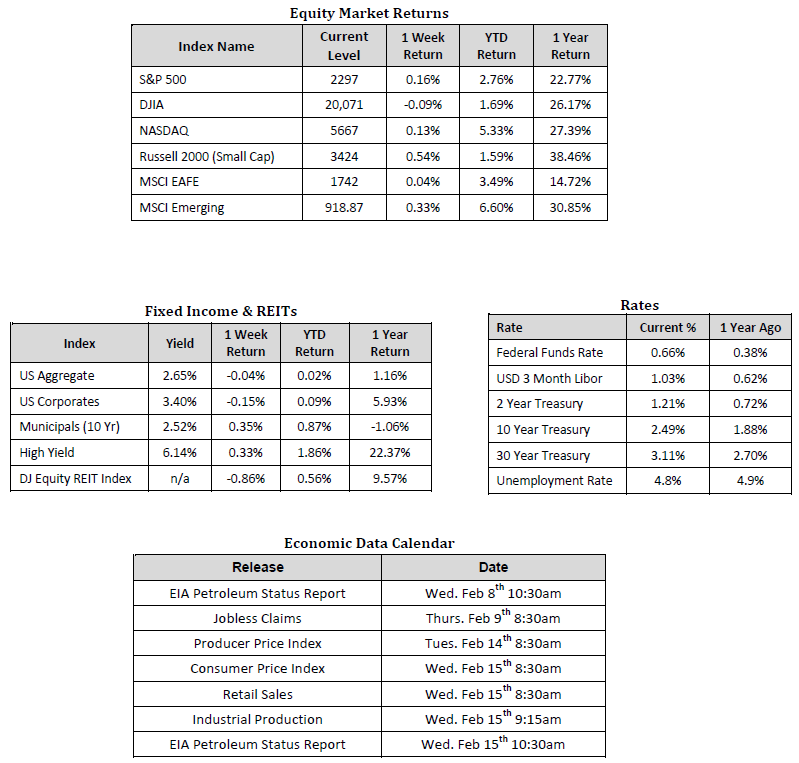
Sources: Equity Market and Fixed Income returns are from JP Morgan as of 2/3/17. REIT, Rates and Economic Calendar Data from Bloomberg as of 2/6/17.
Happening Now
Stocks finished the week marginally higher with the S&P 500 Index gaining 0.2%. U.S. Mid and Small Cap stocks also ended last week with a gain of 0.4% in the Russell Midcap Index and a gain of 0.5% in the Russell 2000 Index. Across these three size groupings; growth stocks have outpaced value stocks so far this year by noticeable margins of 2.5% for large companies, 1.5% for midsized companies, and 2.1% for small firms. Internationally, developed stocks as measured by the MSCI EAFE Index finished the week flat while the MSCI Emerging Market Index gained 0.3%. So far in 2017, international stocks have outperformed their U.S. counterparts. The S&P 500 Index has gained 2.8% year-to-date while the MSCI EAFE Index has gained 3.5% and the MSCI Emerging Market Index 6.6%.
Jobs data was released on Friday and showed the unemployment rate ticked up to 4.8% in January from 4.7% in December. This was due to more Americans “entering the labor market” or actively looking for a job, and thus being included in the calculation. This is in fact encouraging news since it shows gaining confidence in one’s ability to successfully find a new job. In addition, the report showed that 227,000 people gained employment in January, above the consensus estimate of 175,000 and above 2016’s average of 187,000 new works per month.
Earnings data continues to paint an optimistic picture of corporate profitability. Just over half of S&P 500 companies have reported fourth quarter earnings so far this year with 65% beating estimates according to Factset. Earnings growth for the fourth quarter now has a blended rate of 4.6%, giving fundamental support to current stock prices. Despite this support from earnings, prices remain relatively high compared to most fundamental measures suggesting a balanced, diversified approach to investing is crucial for long term success.
Important Information and Disclaimers
Disclosures: Hennion & Walsh is the sponsor of SmartTrust® Unit Investment Trusts (UITs). For more information on SmartTrust® UITs, please visit www.smarttrustuit.com. The overview above is for informational purposes and is not an offer to sell or a solicitation of an offer to buy any SmartTrust® UITs. Investors should consider the Trust’s investment objective, risks, charges and expenses carefully before investing. The prospectus contains this and other information relevant to an investment in the Trust and investors should read the prospectus carefully before they invest.
Investing in foreign securities presents certain risks not associated with domestic investments, such as currency fluctuation, political and economic instability, and different accounting standards. This may result in greater share price volatility. These risks are heightened in emerging markets.
There are special risks associated with an investment in real estate, including credit risk, interest rate fluctuations and the impact of varied economic conditions. Distributions from REIT investments are taxed at the owner’s tax bracket.
The prices of small company and mid cap stocks are generally more volatile than large company stocks. They often involve higher risks because smaller companies may lack the management expertise, financial resources, product diversification and competitive strengths to endure adverse economic conditions.
Investing in commodities is not suitable for all investors. Exposure to the commodities markets may subject an investment to greater share price volatility than an investment in traditional equity or debt securities. Investments in commodities may be affected by changes in overall market movements, commodity index volatility, changes in interest rates or factors affecting a particular industry or commodity.
Products that invest in commodities may employ more complex strategies which may expose investors to additional risks.
Investing in fixed income securities involves certain risks such as market risk if sold prior to maturity and credit risk especially if investing in high yield bonds, which have lower ratings and are subject to greater volatility. All fixed income investments may be worth less than original cost upon redemption or maturity. Bond Prices fluctuate inversely to changes in interest rates. Therefore, a general rise in interest rates can result in the decline of the value of your investment.
Definitions
MSCI- EAFE: The Morgan Stanley Capital International Europe, Australasia and Far East Index, a free float-adjusted market capitalization index that is designed to measure developed-market equity performance, excluding the United States and Canada.
MSCI-Emerging Markets: The Morgan Stanley Capital International Emerging Market Index, is a free float-adjusted market capitalization index that is designed to measure the performance of global emerging markets of about 25 emerging economies.
Russell 3000: The Russell 3000 measures the performance of the 3000 largest US companies based on total market capitalization and represents about 98% of the investible US Equity market.
ML BOFA US Corp Mstr [Merill Lynch US Corporate Master]: The Merrill Lynch Corporate Master Market Index is a statistical composite tracking the performance of the entire US corporate bond market over time.
ML Muni Master [Merill Lynch US Corporate Master]: The Merrill Lynch Municipal Bond Master Index is a broad measure of the municipal fixed income market.
Investors cannot directly purchase any index.
LIBOR, London Interbank Offered Rate, is the rate of interest at which banks offer to lend money to one another in the wholesale money markets in London.
The Dow Jones Industrial Average is an unweighted index of 30 “blue-chip” industrial U.S. stocks.
The S&P Midcap 400 Index is a capitalization-weighted index measuring the performance of the mid-range sector of the U.S. stock market, and represents approximately 7% of the total market value of U.S. equities. Companies in the Index fall between S&P 500 Index and the S&P SmallCap 600 Index in size: between $1-4 billion.
DJ Equity REIT Index represents all publicly traded real estate investment trusts in the Dow Jones U.S. stock universe classified as Equity REITs according to the S&P Dow Jones Indices REIT Industry Classification Hierarchy. These companies are REITSs that primarily own and operate income-producing real estate.