
Fed Policy Mixes with Geopolitical Tensions
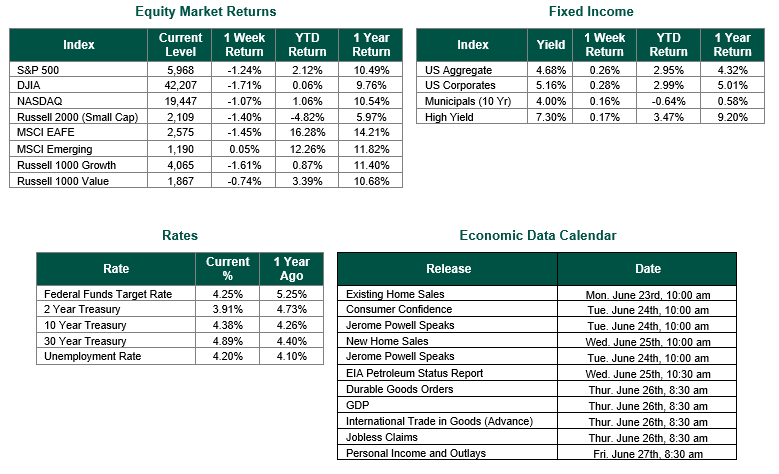
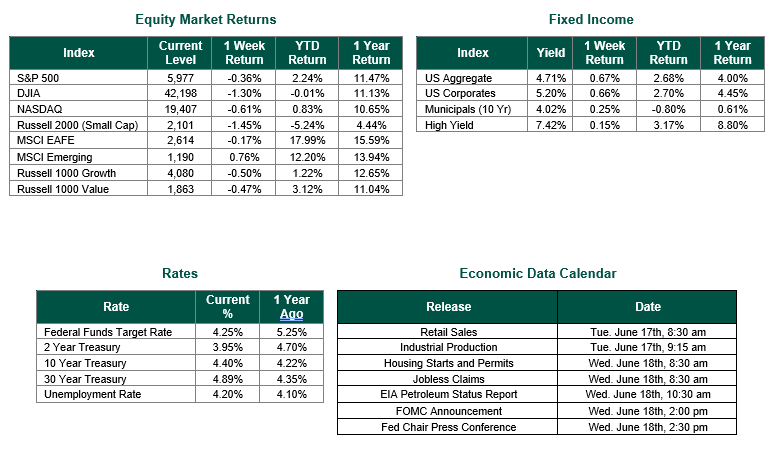
Global equity markets finished lower for the week. In the U.S., the S&P 500 Index closed the week at a level of 5,968, representing a decline of 1.24%, while the Russell Midcap Index moved up 0.57% last week. Meanwhile, the Russell 2000 Index, a measure of the Nation’s smallest publicly traded firms, returned –1.40% over the week. As developed international equity performance and emerging markets were mixed, returning –1.45% and 0.05%, respectively. Finally, the 10-year U.S. Treasury yield moved higher, closing the week at 4.38%.
Last week, a mix of economic signals and geopolitical tensions drove financial markets. Geopolitical tensions escalated in the Middle East as Israel and Iran exchanged military strikes. These events pushed crude oil prices up by 12% during the week, raising concerns that higher energy costs could reignite inflation. U.S. Treasury yields also climbed in response to the uncertainty. The success of the targeted strikes on Iran over the weekend appears to have calmed the markets on Monday morning. However, the current state of relative calm could certainly change if tensions between the U.S., Israel, and Iran escalate further during the week.
The Federal Reserve met for their June FOMC meeting last week and held a press conference on Wednesday. Our customers are aware that we carefully monitor Chairman Powell’s comments and the quarterly Summary of Economic Projections from the Federal Reserve. The following is our analysis of the current position of the Federal Reserve.
As widely anticipated, the Federal Reserve chose to hold steady once again, leaving the Federal Funds Target Rate within a range of 4.25% to 4.50%. The Fed also maintained its forecast of two rate cuts totaling 50 basis points (Bp) in 2025, as reflected in the updated Dot Plot chart. This decision came despite speculation from some Wall Street strategists that the forecast might be revised to just one—or even no—rate cuts for the year. Looking ahead, the Fed adjusted its outlook by projecting only one rate cut of 25 Bp in 2026, down from two following its March meeting, while maintaining the expectation for one additional 25 Bp cut in 2027. Collectively, these forecasted reductions position the federal funds rate just slightly above the Fed’s long-run neutral estimate of around 3.0%.
According to the June 2025 Summary of Economic Projections, the Fed now expects the unemployment rate to reach 4.5% by the end of 2025 (up from 4.4% in March) and remain at 4.5% through the end of 2026 (above the previous 4.3% projection). Core PCE inflation is forecasted to end 2025 at 3.1% (up from 2.8%) and decline to 2.4% by year-end 2026 (compared to 2.2% previously), gradually approaching the Fed’s 2% target by 2027. Real GDP growth is expected to slow to 1.4% in 2025 (down from 1.7%) and rise slightly to 1.6% in 2026 (versus the earlier 1.8% forecast).
If these projections hold, the combination of tepid economic growth, elevated inflation, and higher unemployment, especially considering the Fed’s concerns over the inflationary effects of proposed tariffs, could result in a period of stagflation. For now, the Fed is maintaining a “wait and see” stance regarding tariffs and other policy shifts. This cautious posture, while understandable, could potentially delay necessary policy easing. Fed Chair Jerome Powell remains optimistic, asserting that “despite elevated uncertainty, the economy is in a solid position. The unemployment rate remains low, and the labor market is at or near maximum employment. Inflation has come down a great deal but has been running somewhat above our 2 percent longer-run objective.”
In our view, the first rate cut of 2025 could materialize as soon as the July FOMC meeting, but more likely may occur in September, given there is no meeting scheduled for August. That said, only the views of the voting FOMC members ultimately shape these decisions. Attempting to outguess the Fed often proves unproductive and can lead to periods of market volatility throughout the year.
Best wishes for the week ahead!
Equity and Fixed Income Index returns sourced from Bloomberg on 6/20/25. Economic Calendar Data from Econoday as of 6/20/25. International developed markets are measured by the MSCI EAFE Index, emerging markets are measured by the MSCI EM Index, and U.S. Large Caps are defined by the S&P 500 Index. Sector performance is measured using the GICS methodology.
Disclosures: Past performance does not guarantee future results. We have taken this information from sources that we believe to be reliable and accurate. Hennion and Walsh cannot guarantee the accuracy of said information and cannot be held liable. You cannot invest directly in an index. Diversification can help mitigate the risk and volatility in your portfolio but does not ensure a profit or guarantee against a loss.