Fed Raises Rates and Announces Balance Sheet Reduction Plans
Market Overview
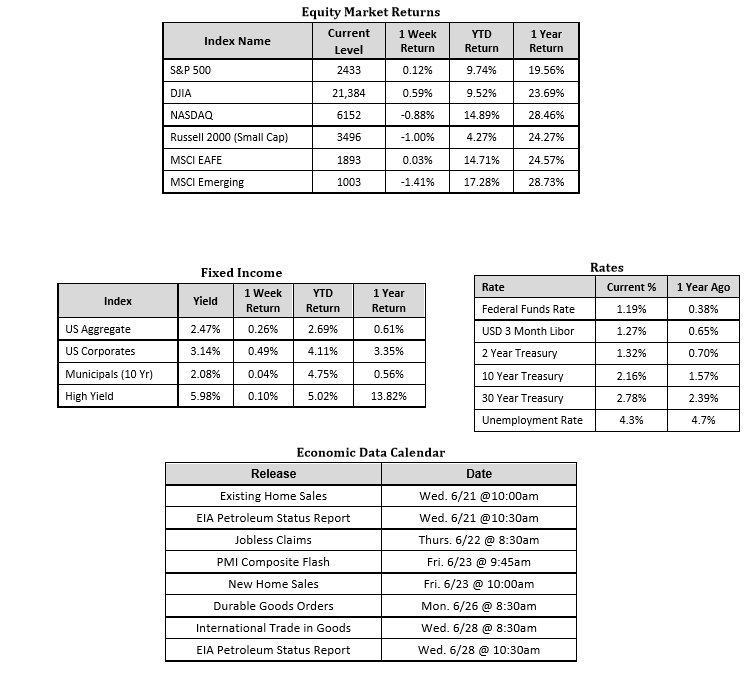
Sources: Equity Market and Fixed Income returns are from JP Morgan as of 06/16/17. Rates and Economic Calendar Data from Bloomberg as of 06/19/17.
Happening Now
U.S. Stocks finished mixed last week as the S&P 500 Index gained 0.1%, the NASDAQ lost 0.9%, and the Dow Jones Industrial Average moved 0.6% higher. Midcap stocks were the best performing domestic group by market capitalization with a 0.4% gain, while Small cap stocks, as measured by the Russell 2000 Index, fell by 1%. In terms of international stock market performance, developed markets ended the week flat while emerging markets gave back 1.4%. In terms of year-to-date performance so far in 2017, international stocks continue to overshadow the U.S. with developed markets up 14.7% and emerging markets up 17.3%. The S&P 500 index by comparison is up by a still impressive 9.7% since the start of the year.
The Federal Reserve Open Market Committee (FOMC) did in fact raise interest rates last Wednesday by the widely expected margin of 0.25%. This was done in the face of three consecutive months of lower than expected inflation, a condition Chair Yellen acknowledged, suggesting it was likely to be a temporary decline that will revert back to more normal levels during the months ahead. In addition to the rate hike announcement, the FOMC also provided some details on their plans to reduce the size of their nearly $4.5 trillion balance sheet. When the committee deems appropriate (likely later this year), based on financial conditions, they will partially cease the reinvestment of principal of maturing Treasuries and Mortgage Back Securities. Once implemented, the plan would reduce reinvestment by $10B a month for three months and then accelerate that figure quarterly to a maximum of $50B per month. This process will continue until the committee judges the size of their balance sheet to be adequate to conduct monetary policy effectively.
The Fed has now raised rates twice in 2017 and three times in the past 7 months, each time by a quarter of 1%. An interesting observation to take note of is that while the Federal Funds Target Rate was increased 0.75% over this time period, the yield on the 10 year U.S. Treasury fell from 2.54% on December 14 to 2.16% as of Friday, June 16. This highlights an often overlooked point that not all borrowing rates move in tandem. A higher Fed Funds rates does not necessarily translate to higher yields on different types of bonds. Economic growth is likely to continue and will justify marginally higher short term interest rates. However, absent meaningfully higher inflation, it is unlikely that rates will return to historically normal levels during the medium term.
Important Information and Disclaimers
Disclosures: Hennion & Walsh is the sponsor of SmartTrust® Unit Investment Trusts (UITs). For more information on SmartTrust® UITs, please visit www.smarttrustuit.com. The overview above is for informational purposes and is not an offer to sell or a solicitation of an offer to buy any SmartTrust® UITs. Investors should consider the Trust’s investment objective, risks, charges and expenses carefully before investing. The prospectus contains this and other information relevant to an investment in the Trust and investors should read the prospectus carefully before they invest.
Investing in foreign securities presents certain risks not associated with domestic investments, such as currency fluctuation, political and economic instability, and different accounting standards. This may result in greater share price volatility. These risks are heightened in emerging markets.
There are special risks associated with an investment in real estate, including credit risk, interest rate fluctuations and the impact of varied economic conditions. Distributions from REIT investments are taxed at the owner’s tax bracket.
The prices of small company and mid cap stocks are generally more volatile than large company stocks. They often involve higher risks because smaller companies may lack the management expertise, financial resources, product diversification and competitive strengths to endure adverse economic conditions.
Investing in commodities is not suitable for all investors. Exposure to the commodities markets may subject an investment to greater share price volatility than an investment in traditional equity or debt securities. Investments in commodities may be affected by changes in overall market movements, commodity index volatility, changes in interest rates or factors affecting a particular industry or commodity.
Products that invest in commodities may employ more complex strategies which may expose investors to additional risks.
Investing in fixed income securities involves certain risks such as market risk if sold prior to maturity and credit risk especially if investing in high yield bonds, which have lower ratings and are subject to greater volatility. All fixed income investments may be worth less than original cost upon redemption or maturity. Bond Prices fluctuate inversely to changes in interest rates. Therefore, a general rise in interest rates can result in the decline of the value of your investment.
Definitions
MSCI- EAFE: The Morgan Stanley Capital International Europe, Australasia and Far East Index, a free float-adjusted market capitalization index that is designed to measure developed-market equity performance, excluding the United States and Canada.
MSCI-Emerging Markets: The Morgan Stanley Capital International Emerging Market Index, is a free float-adjusted market capitalization index that is designed to measure the performance of global emerging markets of about 25 emerging economies.
Russell 3000: The Russell 3000 measures the performance of the 3000 largest US companies based on total market capitalization and represents about 98% of the investible US Equity market.
ML BOFA US Corp Mstr [Merill Lynch US Corporate Master]: The Merrill Lynch Corporate Master Market Index is a statistical composite tracking the performance of the entire US corporate bond market over time.
ML Muni Master [Merill Lynch US Corporate Master]: The Merrill Lynch Municipal Bond Master Index is a broad measure of the municipal fixed income market.
Investors cannot directly purchase any index.
LIBOR, London Interbank Offered Rate, is the rate of interest at which banks offer to lend money to one another in the wholesale money markets in London.
The Dow Jones Industrial Average is an unweighted index of 30 “blue-chip” industrial U.S. stocks.
The S&P Midcap 400 Index is a capitalization-weighted index measuring the performance of the mid-range sector of the U.S. stock market, and represents approximately 7% of the total market value of U.S. equities. Companies in the Index fall between S&P 500 Index and the S&P SmallCap 600 Index in size: between $1-4 billion.
DJ Equity REIT Index represents all publicly traded real estate investment trusts in the Dow Jones U.S. stock universe classified as Equity REITs according to the S&P Dow Jones Indices REIT Industry Classification Hierarchy. These companies are REITSs that primarily own and operate income-producing real estate.