Last Week’s Markets in Review: Are Investors Concerned with Elections?

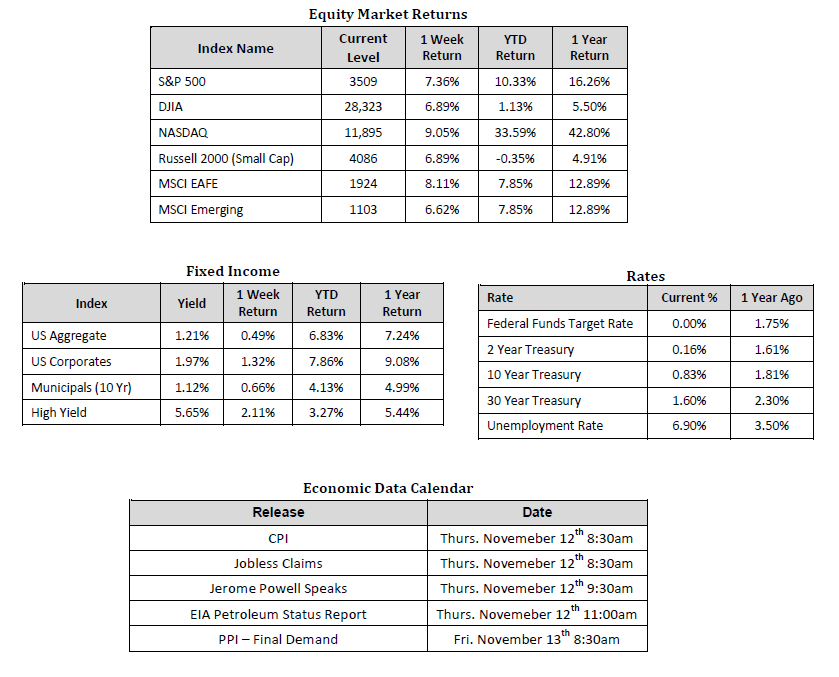
Global equity markets rallied substantially higher on the unexpected prospect of a divided U.S. government, as well as a sizeable decrease in the unemployment rate, which fell to 6.9%. In the U.S., the S&P 500 Index propelled to a level of 3,509, representing an astounding 7.36% increase, while the Russell Midcap Index pushed 6.92% higher last week. Meanwhile, the Russell 2000 Index, a measure of the Nation’s smallest publicly traded firms, returned 6.89% over the week. Moreover, developed and emerging international markets returned 8.11% and 6.62%, respectively. Finally, the 10-year U.S. Treasury fell to 0.83%, five basis points lower than the prior week.
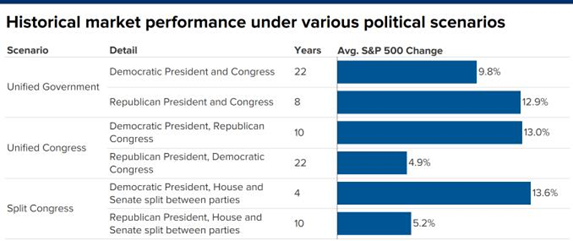
The current unresolved state of U.S. elections and the performance of most major capital markets since election results began to trickle in should again serve as a reminder of the power of “time in the market” and the potential perils of trying to “time the market.” Many pollsters, pundits, and market participants anticipated seeing election results that would have put one political party in control. However, it appears at this time that political gridlock, rather than single-party control, may be in store for Washington D.C. for the next two years. While things can certainly change, many now believe that there will be a balance of power in Congress where Democrats may maintain control of the House of Representatives while Republicans may retain control of the Senate. So what implications does a divided government have for investors to consider? Under this scenario, gridlock and status quo should be expected, and stock markets have historically performed relatively well when that was the case. Recognizing that past performance is not indicative of future results and that this time may be different than prior times, it may still be helpful to review what has happed historically under different scenarios
As you can see in the CFRA chart below, U.S. stocks have generated the most robust returns when the government was divided and there was a Democratic President with a split congress; therefore we shouldn’t be too surprised that U.S. stocks, as represented by the S&P 500 Index, have rallied 4.20% since the polls closed on November 3.

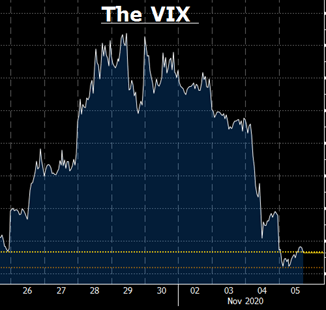
Another popular gauge of market sentiment, the CBOE Volatility Index, or the VIX, appears to validate that the prospect of a divided government is a favorable outcome for U.S. stocks, as we can see a precipitous drop in implied volatility following Election Day.

Source: Bloomberg as of 11/5/2020
So, what can investors learn from the second election outcome surprise in the last eight years? Perhaps that capital markets can be highly unpredictable, and their reaction to particular events may be totally counter to what consensus originally called for. We saw this following the 2016 election, and we are currently witnessing it again after this election. The best way to mitigate the perils of faulty market timing is to try and resist the psychological urge to jump in and out of the market. Instead, we would recommend that investors build portfolios based on specific risk tolerances and investment objectives and maintain discipline unless either of those factors changes materially. Rarely, if ever, is it advantageous to react to sensational media headlines by abandoning equity exposure entirely, making drastic changes to your investments, or asset allocation strategies.
For this reason, we continue to encourage investors to stay disciplined and work with experienced financial professionals to help manage their portfolios through various market cycles within an appropriately diversified framework consistent with their objectives, timeframe, and tolerance for risk.
Finally, we would be remiss not to mention that stock market futures are trading significantly higher on Monday morning as we write this note, likely largely due to news that Pfizer and BioNTech’s COVID-19 vaccine proved to be 90% effective in the first 94 tested patients.
We recognize that these are very troubling and uncertain times, and we want you to know that we are always here to help in any way we can. Please stay safe and stay well.
Other Data Sources: Equity Market and Fixed Income returns are from JP Morgan as of 11/6/20. Rates and Economic Calendar Data from Bloomberg as of 11/6/20. International developed markets measured by the MSCI EAFE Index, emerging markets measured by the MSCI EM Index, U.S. Large Cap defined by the S&P 500. Sector performance is measured using GICS methodology. S&P 500 sector performance represents total return figures sourced from Bloomberg. CFRA chart titled, “Historical market performance under various political scenarios” analyzes average annual total returns for the S&P 500 Index from 1945 to September 30, 2020.
Diversification can help mitigate the risk and volatility in your portfolio but does not ensure a profit or guarantee against loss.
Investing in commodities is not suitable for all investors. Exposure to the commodities markets may subject an investment to greater share price volatility than an investment in traditional equity or debt securities. Investments in commodities may be affected by changes in overall market movements, commodity index volatility, changes in interest rates or factors affecting a particular industry or commodity.
Products that invest in commodities may employ more complex strategies which may expose investors to additional risks.
Investing in fixed income securities involves certain risks such as market risk if sold prior to maturity and credit risk especially if investing in high yield bonds, which have lower ratings and are subject to greater volatility. All fixed income investments may be worth less than the original cost upon redemption or maturity. Bond Prices fluctuate inversely to changes in interest rates. Therefore, a general rise in interest rates can result in the decline of the value of your investment.
Definitions
MSCI- EAFE: The Morgan Stanley Capital International Europe, Australasia and Far East Index, a free float-adjusted market capitalization index that is designed to measure developed-market equity performance, excluding the United States and Canada.
MSCI-Emerging Markets: The Morgan Stanley Capital International Emerging Market Index, is a free float-adjusted market capitalization index that is designed to measure the performance of global emerging markets of about 25 emerging economies.
Russell 3000: The Russell 3000 measures the performance of the 3000 largest US companies based on total market capitalization and represents about 98% of the investible US Equity market.
ML BOFA US Corp Mstr [Merill Lynch US Corporate Master]: The Merrill Lynch Corporate Master Market Index is a statistical composite tracking the performance of the entire US corporate bond market over time.
ML Muni Master [Merill Lynch US Corporate Master]: The Merrill Lynch Municipal Bond Master Index is a broad measure of the municipal fixed income market.
Investors cannot directly purchase any index.
LIBOR, London Interbank Offered Rate, is the rate of interest at which banks offer to lend money to one another in the wholesale money markets in London.
The Dow Jones Industrial Average is an unweighted index of 30 “blue-chip” industrial U.S. stocks.
The S&P Midcap 400 Index is a capitalization-weighted index measuring the performance of the mid-range sector of the U.S. stock market and represents approximately 7% of the total market value of U.S. equities. Companies in the Index fall between S&P 500 Index and the S&P SmallCap 600 Index in size: between $1-4 billion.
DJ Equity REIT Index represents all publicly traded real estate investment trusts in the Dow Jones U.S. stock universe classified as Equity REITs according to the S&P Dow Jones Indices REIT Industry Classification Hierarchy. These companies are REITs that primarily own and operate income-producing real estate.


