Last Week’s Markets in Review: Are Markets Buying What the Fed is Selling?
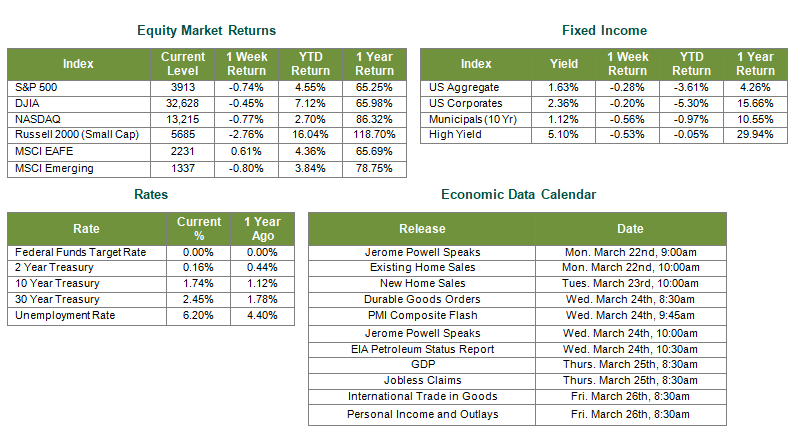
U.S. stocks moved lower while international markets finished mixed for the week. In the U.S., the S&P 500 Index fell to a level of 3,913, representing a loss of 0.74%, while the Russell Midcap Index moved 0.79% lower last week. Meanwhile, the Russell 2000 Index, a measure of the Nation’s smallest publicly traded firms, faced the largest setback returning -2.76% over the week. International equities fluctuated throughout the week and developed and emerging markets returned 0.61% and -0.80%, respectively. Finally, the 10-year U.S. Treasury yield continued to move higher to 1.74%, increasing 10 basis points over the week.
On Wednesday of last week, the Federal Reserve announced that they would leave the Federal Funds target rate unchanged within its current range of 0.00%-0.25% and will continue to buy $80 billion and $40 billion worth of Treasury and agency mortgage‑backed securities per month, respectively. The Fed suggested that their accommodative positioning will continue as the COVID-19 hardships persist and the economy continues to heal. While this news was largely expected, other outtakes and implications from this meeting were significant. This Federal Open Market Committee (FOMC) meeting was, in fact, the first since widespread inflationary concerns heated up in 2021. In past weekly updates, we’ve discussed in length the mounting inflationary pressures, what’s driving them, and how various areas of the capital markets are affected. Therefore, as a rate setter and potential inflation influencer, we were dialed in on what the Fed had to say last week.
We learned that by the end of 2021, the Fed now expects gross domestic product (GDP) to reach 6.5%, the unemployment rate to decline to 4.5%, and inflation to settle in around 2.2%. These numbers contrast to their expectations for GDP, unemployment, and inflation of 4.5%, 5%, and 1.8%, respectively, just three months ago. Despite the upgraded outlook, the latest “dot plot” still suggests that a hike in rates likely won’t come until 2023. The Fed doesn’t see inflationary pressures equating to a need to change their current policy stance or interest rates target range. Chairman Powell also made a point to mention a reported uptick in inflation could result simply due to; 1) how it is calculated, on a trailing 12-month basis, with the low inflation periods of March and April of 2020 dropping from that calculation, and 2) businesses reopening and increased spending overall. Remember, in addition to fiscal stimulus, inflationary pressures can be attributable to the unusual circumstances of a severely restricted economy reopening and returning to a level of relative normalcy. The Fed sees an increase in inflation from these factors as transient, and they would exercise patience before making material changes to their interest rate policy.
While inflation may not be a concern for the Fed at this time, many investors and money managers certainly don’t share in the sentiment. In the latest fund manager survey from Bank of America, higher than expected inflation has overtaken the COVID-19 vaccine roll-out as the most significant perceived “tail risk,” or an event resulting in substantial unexpected negative returns.
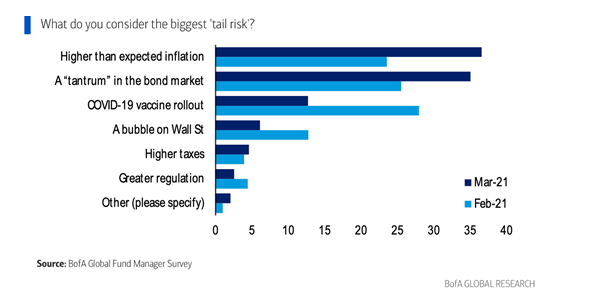
This is a significant shift from just a month ago. Surprisingly, potential issues with the deployment of a vaccine to combat a virus that crippled the global economy are no longer the chief concern for market participants, at least according to this survey.
Regardless, with the heightened possibility of increasing inflation and the recent movements in interest rates throughout credit markets, most of the firms we follow have recently raised their year-end U.S. Treasury yield forecasts accordingly. While the Fed may not increase rates until 2023, the market is also mindful of any potential changes to the U.S. Treasury and mortgage-backed securities (MBS) purchasing policies, also evidenced in the graph above, as some believe tapering may occur as early as this year. You may recall the “taper tantrum” of 2013 and spike in yields from the Fed’s announcement of its quantitative easing policy’s tapering. While the circumstances are meaningfully different from those of 2013, it is important to remember that markets are essentially forward-looking and often react to changes that may affect certain assets and asset classes.
As always, we continue to encourage investors to stay disciplined and work with experienced financial professionals to help manage their portfolios through various market cycles within an appropriately diversified framework that is consistent with their growth and/or income objectives, time-frame, and risk tolerance. Best wishes for the week ahead!
Sources for data in tables: Equity Market and Fixed Income returns are from JP Morgan as of 3/19/21. Rates and Economic Calendar Data from Bloomberg as of 3/19/21. International developed markets measured by the MSCI EAFE Index, emerging markets measured by the MSCI EM Index, U.S. Large Cap defined by the S&P 500. Sector performance is measured using the GICS methodology.
Disclosures: Past performance does not guarantee future results. We have taken this information from sources that we believe to be reliable and accurate. Hennion and Walsh cannot guarantee the accuracy of said information and cannot be held liable. You cannot invest directly in an index. Diversification can help mitigate the risk and volatility in your portfolio but does not ensure a profit or guarantee against a loss.
Diversification can help mitigate the risk and volatility in your portfolio but does not ensure a profit or guarantee against loss.
Investing in commodities is not suitable for all investors. Exposure to the commodities markets may subject an investment to greater share price volatility than an investment in traditional equity or debt securities. Investments in commodities may be affected by changes in overall market movements, commodity index volatility, changes in interest rates or factors affecting a particular industry or commodity.
Products that invest in commodities may employ more complex strategies which may expose investors to additional risks.
Investing in fixed income securities involves certain risks such as market risk if sold prior to maturity and credit risk especially if investing in high yield bonds, which have lower ratings and are subject to greater volatility. All fixed income investments may be worth less than the original cost upon redemption or maturity. Bond Prices fluctuate inversely to changes in interest rates. Therefore, a general rise in interest rates can result in the decline of the value of your investment.
Definitions
MSCI- EAFE: The Morgan Stanley Capital International Europe, Australasia and Far East Index, a free float-adjusted market capitalization index that is designed to measure developed-market equity performance, excluding the United States and Canada.
MSCI-Emerging Markets: The Morgan Stanley Capital International Emerging Market Index, is a free float-adjusted market capitalization index that is designed to measure the performance of global emerging markets of about 25 emerging economies.
Russell 3000: The Russell 3000 measures the performance of the 3000 largest US companies based on total market capitalization and represents about 98% of the investible US Equity market.
ML BOFA US Corp Mstr [Merill Lynch US Corporate Master]: The Merrill Lynch Corporate Master Market Index is a statistical composite tracking the performance of the entire US corporate bond market over time.
ML Muni Master [Merill Lynch US Corporate Master]: The Merrill Lynch Municipal Bond Master Index is a broad measure of the municipal fixed income market.
Investors cannot directly purchase any index.
LIBOR, London Interbank Offered Rate, is the rate of interest at which banks offer to lend money to one another in the wholesale money markets in London.
The Dow Jones Industrial Average is an unweighted index of 30 “blue-chip” industrial U.S. stocks.
The S&P Midcap 400 Index is a capitalization-weighted index measuring the performance of the mid-range sector of the U.S. stock market and represents approximately 7% of the total market value of U.S. equities. Companies in the Index fall between S&P 500 Index and the S&P SmallCap 600 Index in size: between $1-4 billion.
DJ Equity REIT Index represents all publicly traded real estate investment trusts in the Dow Jones U.S. stock universe classified as Equity REITs according to the S&P Dow Jones Indices REIT Industry Classification Hierarchy. These companies are REITs that primarily own and operate income-producing real estate.