Last Week’s Markets in Review: Are You Looking for Yield in all the Wrong Places?

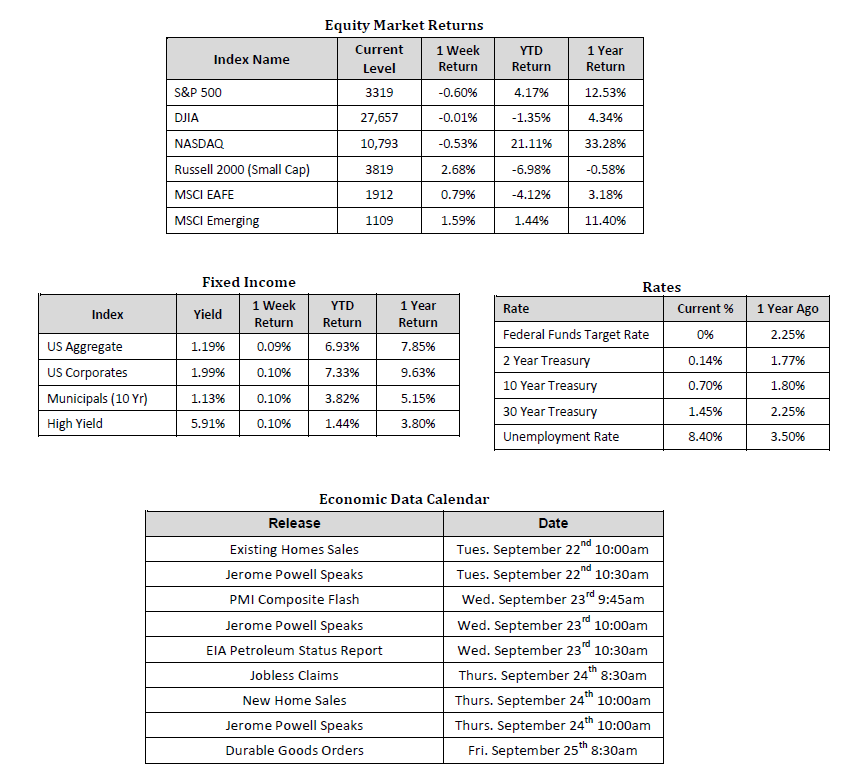
Global equity markets were mixed on the week, with U.S. large-cap equities taking a backseat to international markets. In the U.S., the S&P 500 Index fell to a level of 3,319, representing a loss of 0.60%, while the Russell Midcap Index pushed 1.10% higher last week. Meanwhile, the Russell 2000 Index, a measure of the Nation’s smallest publicly traded firms, returned 2.68% over the week. Moreover, developed and emerging international markets returned 0.79% and 1.59%, respectively. Finally, the 10-year U.S. Treasury pressed to 0.70%, 3 basis points higher than the prior week.
In other news, Supreme Court Justice Ruth Bader-Ginsburg passed away after a lengthy battle with cancer. Her passing is likely to lead to a heated debate between democrats and republicans as to whether her Supreme Court seat should be filled before November’s Presidential and Congressional elections, and will almost certainly increase already elevated volatility in the weeks leading up to Election Day.
On the economic data front, Industrial Production and Retail Sales registered increases of 0.4% and 0.6% respectively, less than the gains of 1.2% and 0.9% respectively that were expected, but positive nonetheless. Moreover, Housing Starts and Jobless Claims both posted results in-line with expectations. Housing Starts increased by 1.42 million, slightly lower than the consensus forecast for 1.49 million, while Jobless Claims increased by 860,000, ten thousand more than anticipated, but lower than the previous week’s total of 893,000 claims. Finally, Federal Reserve Chairman Jerome Powell reiterated the Fed’s commitment to maintaining low-interest rates.
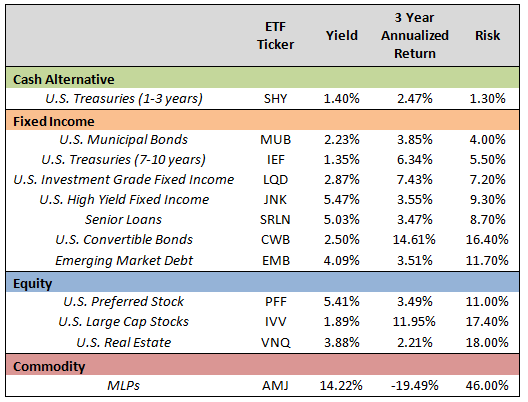
As it relates to low-interest rates, with the U.S. 10 year treasury yield hovering around 0.70%, and traditional savings and money market accounts potentially yielding even less, investors are feverishly searching for alternative ways to generate income. Our objective in this week’s market update is to outline the historical risk, return, and yield of various options currently available to those investors with income-production objectives. Our hope is that those presently chasing yield will at least have a better understanding of the potential risk associated with yields higher than the average money market account.
The table below contains some of the most common asset classes, and investment categories, using representative exchange-traded funds (ETFs) for each investment category. However, before diving into the data in the table, we’d like to stress, as always, that the composition of one’s portfolio should always reflect that individual’s investment objective but staying consistent with one’s risk tolerance is of the utmost importance. Greater return potential typically equates to greater potential risk, and if an investment opportunity sounds too good to be true, it typically is. As such, some of the investment classes below may not be appropriate for all investors. It’s also important to remember that U.S. Municipal Bonds are typically free from federal taxes, and thus offer higher taxable-equivalent yields than what is listed below.

Please note: Yield, 3 Year annualized total return, and volatility data was sourced from Morningstar as of 09/18/2020. Past performance is not an indication of future results.
Investors searching for income who are considering turning to sources they may be unfamiliar with may benefit from first assessing the historical volatility associated with each security type. For instance, many investors may initially be attracted to the headline yield produced by Master Limited-Partnerships (MLPs), but may not be as attracted when they appreciate the amount of potential volatility involved with MLPs. Moreover, investors with a willingness and ability to take on more risk than the typical investment-grade fixed income securities, but who are uncomfortable taking on quite as much risk as the standard U.S. large-cap stock, may want to consider an investment in Preferred Stock.
While some of the opportunities above may carry a high level of volatility on a standalone basis, a smaller allocation may not be entirely out of the question assuming the risk is balanced by incorporating other less volatile, less correlated assets in one’s overall portfolio. Having a detailed portfolio review conducted on one’s portfolio can help inform an investor whether such diversification currently exists within their portfolio. As a result, we encourage investors to stay disciplined and work with experienced financial professionals to help manage their portfolios through various market cycles within an appropriately diversified framework that is consistent with their objectives, time-frame, and tolerance for risk.
We recognize that these are very troubling and uncertain times, and we want you to know that we are always here to help in any way we can. Please stay safe and stay well.
Data Sources: Equity Market and Fixed Income returns are from JP Morgan as of 9/21/20. Rates and Economic Calendar Data from Bloomberg as of 9/21/20. International developed markets measured by the MSCI EAFE Index, emerging markets measured by the MSCI EM Index, U.S. Large Cap defined by the S&P 500. Sector performance is measured using GICS methodology. S&P 500 sector performance represents total return figures sourced from Bloomberg.
ETF Sources: iShares 1-3 Year Treasury Bond (SHY), iShares National Muni Bond(MUB), iShares 7-10 Year Treasury Bond (IEF), iShares iBoxx Investment Grade Corporate Bond (LQD), SPDR Bloomberg High Yield Bond (JNK), SPDR Blackstone/GSO Senior Loan(SRLN), SPDR Bloomberg Convertible Securities(CWB), iShares JP Morgan USD Emerging Markets Bond(EMB), iShares Preferred & Income Securities(PFF), iShares Core S&P 500 (IVV), Vanguard Real Estate (VNQ), JP Morgan Alerian MLP (AMJ)
Disclosures: Past performance does not guarantee future results. We have taken this information from sources that we believe to be reliable and accurate. Hennion and Walsh cannot guarantee the accuracy of said information and cannot be held liable. You cannot invest directly in an index.
Diversification can help mitigate the risk and volatility in your portfolio but does not ensure a profit or guarantee against loss.
Investing in commodities is not suitable for all investors. Exposure to the commodities markets may subject an investment to greater share price volatility than an investment in traditional equity or debt securities. Investments in commodities may be affected by changes in overall market movements, commodity index volatility, changes in interest rates or factors affecting a particular industry or commodity.
Products that invest in commodities may employ more complex strategies which may expose investors to additional risks.
Investing in fixed income securities involves certain risks such as market risk if sold prior to maturity and credit risk especially if investing in high yield bonds, which have lower ratings and are subject to greater volatility. All fixed income investments may be worth less than the original cost upon redemption or maturity. Bond Prices fluctuate inversely to changes in interest rates. Therefore, a general rise in interest rates can result in the decline of the value of your investment.
Definitions
MSCI- EAFE: The Morgan Stanley Capital International Europe, Australasia and Far East Index, a free float-adjusted market capitalization index that is designed to measure developed-market equity performance, excluding the United States and Canada.
MSCI-Emerging Markets: The Morgan Stanley Capital International Emerging Market Index, is a free float-adjusted market capitalization index that is designed to measure the performance of global emerging markets of about 25 emerging economies.
Russell 3000: The Russell 3000 measures the performance of the 3000 largest US companies based on total market capitalization and represents about 98% of the investible US Equity market.
ML BOFA US Corp Mstr [Merill Lynch US Corporate Master]: The Merrill Lynch Corporate Master Market Index is a statistical composite tracking the performance of the entire US corporate bond market over time.
ML Muni Master [Merill Lynch US Corporate Master]: The Merrill Lynch Municipal Bond Master Index is a broad measure of the municipal fixed income market.
Investors cannot directly purchase any index.
LIBOR, London Interbank Offered Rate, is the rate of interest at which banks offer to lend money to one another in the wholesale money markets in London.
The Dow Jones Industrial Average is an unweighted index of 30 “blue-chip” industrial U.S. stocks.
The S&P Midcap 400 Index is a capitalization-weighted index measuring the performance of the mid-range sector of the U.S. stock market and represents approximately 7% of the total market value of U.S. equities. Companies in the Index fall between S&P 500 Index and the S&P SmallCap 600 Index in size: between $1-4 billion.
DJ Equity REIT Index represents all publicly traded real estate investment trusts in the Dow Jones U.S. stock universe classified as Equity REITs according to the S&P Dow Jones Indices REIT Industry Classification Hierarchy. These companies are REITs that primarily own and operate income-producing real estate.


