Last Week’s Markets in Review: Considering Developed International Stocks for 2021?
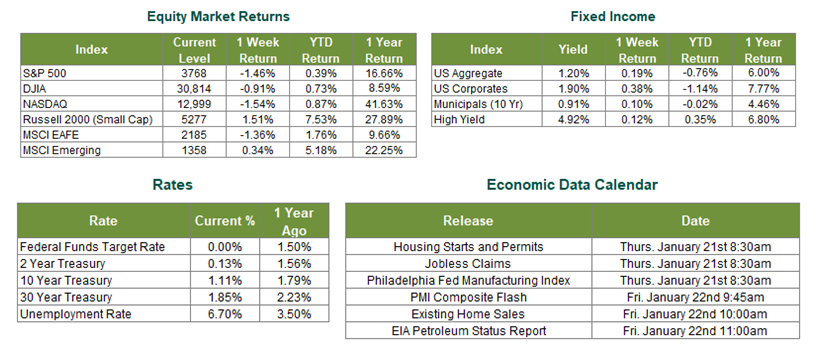
Global equity markets were mixed on the week, with developed markets trading lower, while emerging markets moved higher. In the U.S., the S&P 500 Index fell to a level of 3,768, representing a 1.46% loss, while the Russell Midcap Index was essentially flat on the week, falling 0.01%. Meanwhile, the Russell 2000 Index, a measure of the Nation’s smallest publicly traded firms, pushed 1.51% higher for the week. Moreover, developed and emerging international markets returned -1.36% and 0.34%, respectively. Finally, the 10-year U.S. Treasury fell to 1.11%, two basis points lower than the prior week.
In economic news, initial jobless claims once again surprised to the upside with 965,000 people filing new unemployment claims, compared to the 790,000 that had been expected to file. Moreover, month-over-month Retail Sales declined by 0.7%, while consensus called for just a 0.1% drop. Both data points are concerning and will require careful monitoring in the weeks ahead.
In 2021, a growing number of market forecasters expect to see developed international equities take the lead relative to U.S. Large Cap stocks for the first time since 2017 and 2012 before that. After vastly underperforming U.S. Large Cap stocks for the last decade, lagging in eight out of the previous ten years, developed international stocks may finally have their day. If this expectation does come to fruition, it may create an issue for many U.S. investors, who have historically shown a high degree of “home-country bias”. In other words, a large number of U.S. investors believe that they have better insight regarding corporations domiciled in their home country, and thus explicitly decide to heavily overweight U.S. stocks in their respective portfolios. And frankly, who can blame U.S. investors for favoring U.S. stocks considering that the S&P 500 Index has returned roughly 265% over the last decade, while the MSCI EAFE (EAFE = Europe, Australia, and the Far East) Index has returned roughly 69%?
With the historical track record of these two markets understood, let’s explore how they stack up to each other currently and attempt to explore why so many believe the performance differential over the last decade will begin to start reversing course in 2021. We’ll start by detailing key differences regarding sector composition, style exposure, holding concentration, and valuation. We utilized the iShares Core S&P 500 ETF (Ticker: IVV) as our designated S&P 500 Index proxy and the iShares MSCI EAFE ETF (Ticker: EFA) as our MSCI EAFE Index proxy to create this comparison. All of the figures in the data tables below were sourced from Morningstar unless otherwise specified.
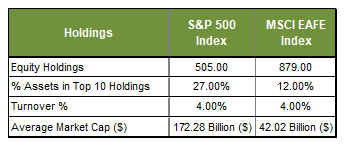
A review of the results above shows that the S&P 500 Index is very top-heavy, with 27% of the total index value in the ten largest holdings. Further evidence of this potential size-oriented concern can be found in the S&P 500’s high average market capitalization of ~$172 Billion. Conversely, the MSCI EAFE appears to offer less concentration amongst the biggest holdings, and a much lower average market capitalization of ~$42 Billion. The smaller nature of the MSCI EAFE constituents may help, in part, explain the enthusiasm that so many have for developed international equities in 2021. With 2021 Global Gross Domestic Product (GDP) growth expected to be well above the average of the last decade, it’s only natural to expect smaller and riskier stocks to rally more than their larger counterparts who are perceived as more stable and better positioned to withstand economic hardship. For evidence of this dynamic at play, we can look to the outperformance of U.S. small-cap stocks, developed international stocks, and emerging market stocks over the last few months. Each of these markets offers a lower average market capitalization and less concentration than the S&P 500 Index, potentially explaining their recent outperformance. Following the adage of, “A rising tide raises all ships,” the MSCI EAFE may just have more ships in the months ahead
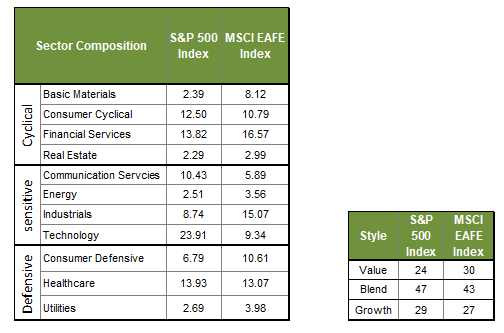
Next, we inspect the differences in sector weightings between both market geographies, followed by a review of their respective style exposures (ex. Value, Blend, Growth). As a reminder, cyclical sectors typically perform well when economic growth is strong, defensive sectors historically perform well when economic growth is weak, and sensitive sectors tend to react more to specific economic shocks such as an unexpected spike in inflation or interest rates. We see from the results above that developed international stocks have a much heavier weighting toward cyclical sectors. In contrast, the S&P 500 Index is more dominant in defensive sectors.
Moreover, developed international stocks are more heavily weighted toward the Value style, while the S&P 500 Index leans more toward the Growth style. Historically, there has been a high correlation between cyclicality and the Value style, and stocks that have exhibited said exposure have outperformed when the 6-12 month economic outlook appeared better than average. This historical behavior may help, at least in part, explain the recent rally in developed international stocks.
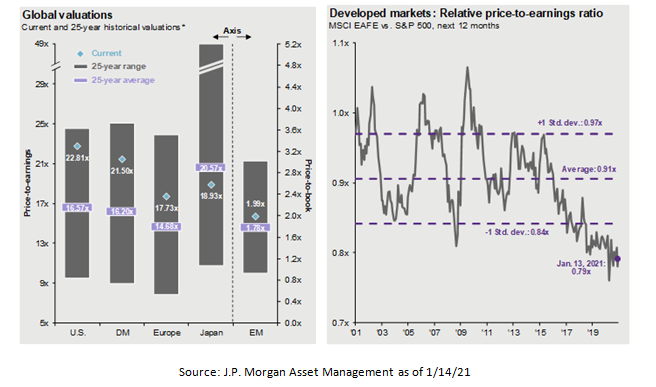
Next, turning to valuations, we can look to the chart on the left, which shows the current valuations of major equity markets compared to their 25-year historical valuations, and the chart on the right, which shows the relative price-to-earnings (P/E) ratio of the MSCI EAFE against the S&P 500 Index. What becomes immediately apparent based on the “Global Valuations” chart is that all markets, except for Japan, are currently trading at valuations that are higher than their historical averages. However, what’s also clear is that U.S. equities are overvalued to a higher degree than their European counterparts, and this point becomes even more apparent when reviewing the chart titled “Developed Markets: Relative price-to-earnings ratio”. Keep in mind, European and Japanese equities make up the lion’s share of the MSCI EAFE index. What’s also worth noting is that, to an extent, higher acceptable equity valuations are justified given the all-time low level of interest rates.
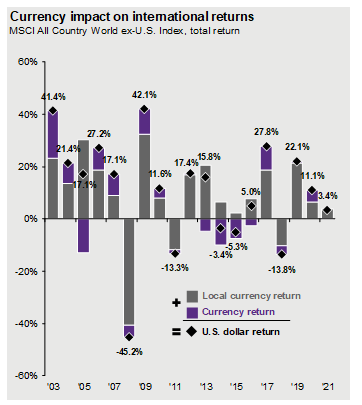
Finally, when evaluating the appeal of developed international stocks relative to U.S. stocks, we have to consider the outlook for the U.S. dollar. Historically, a declining dollar has translated to strong performance for international developed and emerging market stocks. In fact, the MSCI EAFE Index has had a negative 55% correlation to the dollar, while the MSCI Emerging Market Index has had a negative 68% correlation to the dollar. U.S. investors allocating funds to international markets see the return of their investments boosted by the foreign currencies used to purchase foreign securities appreciating. This relationship can be observed in the chart above, which by unsparingly shows an appreciating foreign currency, and by extension, a depreciating U.S. dollar, in nearly every year when the total return was positive.
Although we don’t advocate abandoning U.S. equities altogether, in fact we continue to favor U.S. equities on an absolute basis, we do believe it may be time to consider adding, or increasing, allocations to international equities given all of the factors cited above. Of course, we continue to encourage investors to stay disciplined and work with experienced financial professionals to help build and manage the asset allocations within their portfolios consistent with their objectives, timeframe, and tolerance for risk.
We recognize that these continue to be very troubling and uncertain times across the world, and we want you to know that we are always here to help in any way we can.
Disclosures: Past performance does not guarantee future results. We have taken this information from sources that we believe to be reliable and accurate. Hennion and Walsh cannot guarantee the accuracy of said information and cannot be held liable. You cannot invest directly in an index. Diversification can help mitigate the risk and volatility in your portfolio but does not ensure a profit or guarantee against a loss.
Other Data Sources: Equity Market and Fixed Income returns are from JP Morgan as of 1/15/20. Rates and Economic Calendar Data from Bloomberg as of 1/15/20. International developed markets measured by the MSCI EAFE Index, emerging markets measured by the MSCI EM Index, U.S. Large Cap defined by the S&P 500. Sector performance is measured using GICS methodology. S&P 500 sector performance represents total return figures sourced from Bloomberg. All figures contained in all data tables was sourced from Morningstar as of 1/13/20.
Diversification can help mitigate the risk and volatility in your portfolio but does not ensure a profit or guarantee against loss.
Investing in commodities is not suitable for all investors. Exposure to the commodities markets may subject an investment to greater share price volatility than an investment in traditional equity or debt securities. Investments in commodities may be affected by changes in overall market movements, commodity index volatility, changes in interest rates or factors affecting a particular industry or commodity.
Products that invest in commodities may employ more complex strategies which may expose investors to additional risks.
Investing in fixed income securities involves certain risks such as market risk if sold prior to maturity and credit risk especially if investing in high yield bonds, which have lower ratings and are subject to greater volatility. All fixed income investments may be worth less than the original cost upon redemption or maturity. Bond Prices fluctuate inversely to changes in interest rates. Therefore, a general rise in interest rates can result in the decline of the value of your investment.
Definitions
MSCI- EAFE: The Morgan Stanley Capital International Europe, Australasia and Far East Index, a free float-adjusted market capitalization index that is designed to measure developed-market equity performance, excluding the United States and Canada.
MSCI-Emerging Markets: The Morgan Stanley Capital International Emerging Market Index, is a free float-adjusted market capitalization index that is designed to measure the performance of global emerging markets of about 25 emerging economies.
Russell 3000: The Russell 3000 measures the performance of the 3000 largest US companies based on total market capitalization and represents about 98% of the investible US Equity market.
ML BOFA US Corp Mstr [Merill Lynch US Corporate Master]: The Merrill Lynch Corporate Master Market Index is a statistical composite tracking the performance of the entire US corporate bond market over time.
ML Muni Master [Merill Lynch US Corporate Master]: The Merrill Lynch Municipal Bond Master Index is a broad measure of the municipal fixed income market.
Investors cannot directly purchase any index.
LIBOR, London Interbank Offered Rate, is the rate of interest at which banks offer to lend money to one another in the wholesale money markets in London.
The Dow Jones Industrial Average is an unweighted index of 30 “blue-chip” industrial U.S. stocks.
The S&P Midcap 400 Index is a capitalization-weighted index measuring the performance of the mid-range sector of the U.S. stock market and represents approximately 7% of the total market value of U.S. equities. Companies in the Index fall between S&P 500 Index and the S&P SmallCap 600 Index in size: between $1-4 billion.
DJ Equity REIT Index represents all publicly traded real estate investment trusts in the Dow Jones U.S. stock universe classified as Equity REITs according to the S&P Dow Jones Indices REIT Industry Classification Hierarchy. These companies are REITs that primarily own and operate income-producing real estate.