
Last Week’s Markets in Review: Considering Small-Cap Stocks for 2021?
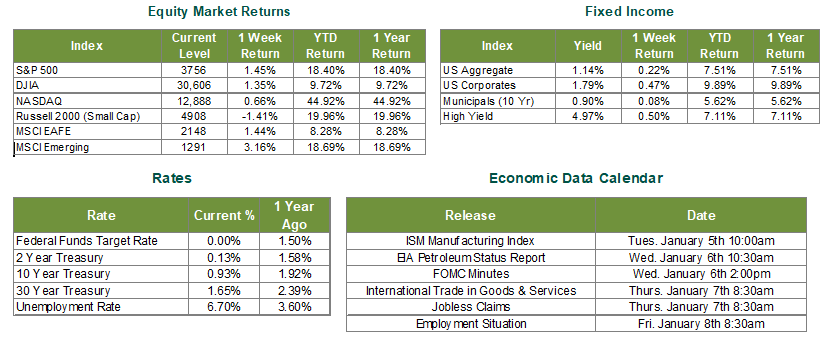
Global equity markets finished 2020 strong as nearly all major indexes pushed higher for the week. In the U.S., the S&P 500 Index rose to a level of 3,756, representing a 1.45% gain, while the Russell Midcap Index was essentially flat on the week, falling 0.01%. Meanwhile, the Russell 2000 Index, a measure of the Nation’s smallest publicly traded firms, fell 1.41% over the week. Moreover, developed and emerging international markets returned 1.44% and 3.16%, respectively. Finally, the 10-year U.S. Treasury fell to 0.93%, one basis point lower than the prior week.
As we leave 2020 thankfully behind and enter the New Year, a growing number of market prognosticators are calling for a rotation from U.S large-cap stocks to U.S. small-cap stocks. This view has only been reinforced by the convincing rally seen in U.S. small-cap stocks over the last few months. Given the focus on this particular rotation trade in 2021, we thought it might be useful to detail key differences between the two market caps, looking particularly at how they compare in terms of sector composition, style exposure, financial metrics, holding concentration, and valuation to name a few. We utilized the S&P 500 Index as our designated “U.S. Large-Cap” proxy and the S&P 600 as our “U.S. Small-Cap” proxy to create this comparison. Also, all of the figures contained in the data tables below were sourced from Morningstar. So, let’s dive into the similarities and differences between these two market capitalizations without further ado.
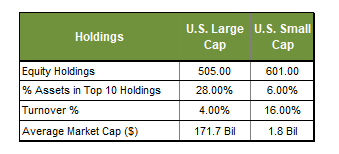
The number of equity holdings in each respective index is unlikely to surprise readers, considering both index names denote how many securities they contain (i.e., the S&P 500 & the S&P 600). However, what may surprise some is to see the degree of concentration in the U.S. large-cap index. The top 10 U.S. large-cap holdings comprise 28% of the total index value, compared to only 6% for the small-cap index. Those concerned about index returns being led by a handful of mega-cap stocks may find the more equal-weighted makeup of the small-cap index more appealing as a result.
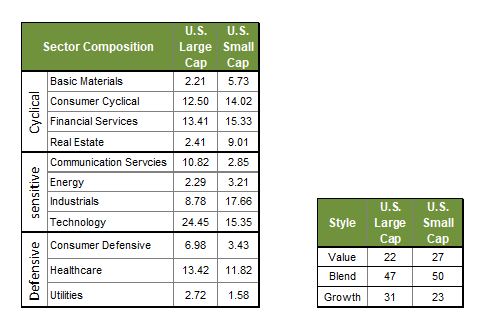
Next, we analyze the differences in sector weightings between both market capitalizations, followed by a review of each market capitalization style (ex. Value, Blend, Growth). You may also notice that specific sectors are categorized as either cyclical, sensitive, or defensive. In general, cyclical sectors perform well when economic growth is strong, defensive sectors perform well when economic growth is weak, and sensitive sectors tend to react more to specific economic shocks such as an unexpected spike in inflation or interest rates. We see from the results above that U.S. small-cap stocks have a much heavier weighting toward cyclical sectors. In contrast, U.S. large-cap stocks are more dominant in defensive sectors (as well as Technology, which is sometimes viewed as defensive).
Furthermore, small-cap tilts more towards the Value style, while large-cap leans more toward the Growth style. We’ve discussed the crossover between cyclicality and value in previous issues of our weekly update and have documented that stocks with these characteristics often outperform when the 6-12 month economic outlook appears better than average. This historical behavior may, at least in part, explain the outperformance by small-cap stocks over the last three months.
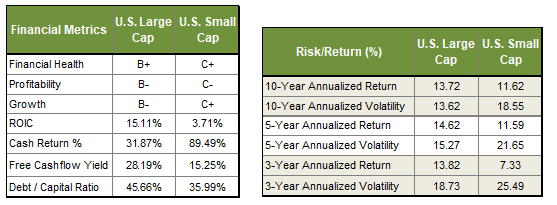
Moreover, we can examine various financial metrics to compare historical earnings and sales growth differentials, current valuations, differences in capital structure, and methods for returning profits to shareholders. You may first notice the letter grades for financial health, profitability, and growth. These are not our proprietary ratings; instead, they are provided by Morningstar. They show that small-cap stocks tend to be lower quality than their larger-cap counterparts and generally carry a higher potential risk, which should translate to a higher possible return. Unfortunately, higher risk has not necessarily translated to higher return potential over recent years, as evidenced by the wide disparity in return on invested capital (ROIC), as well as annualized risk and return figures over the previous 3, 5, and 10 years.
Another result that may surprise readers is the percentage of cash returned to shareholders of large-cap and small-cap companies as smaller companies distribute approximately 90% of their earnings to shareholders, while larger companies only distribute 32% of profits. What’s also clear from this data is that larger companies rely more heavily on debt financing than smaller companies.
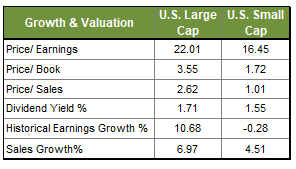
Finally, we can see that smaller companies’ earnings and sales growth have lagged those of larger companies by a significant margin. But what may be more important to those considering an investment in the small-cap space in the future is how their current valuations stack up to the large-cap segment of the market. In fact, small-cap stocks appear to offer better valuations than large-cap stocks based on price to earnings, price to book, and price to sales figures.
While current valuations of U.S. small-cap stocks may appear to offer an attractive entry point, it’s essential to keep in mind that a significant level of risk will accompany over-allocating to such an area of the stock market, and thus may not be appropriate for all investors. As such, we encourage investors to stay disciplined and work with experienced financial professionals to help build and manage the asset allocations within their portfolios consistent with their objectives, timeframe, and tolerance for risk.
We recognize that these continue to be very troubling and uncertain times across the world, and we want you to know that we are always here to help in any way we can. Best wishes for a happy and healthy 2021 to all!
Disclosures: Past performance does not guarantee future results. We have taken this information from sources that we believe to be reliable and accurate. Hennion and Walsh cannot guarantee the accuracy of said information and cannot be held liable. You cannot invest directly in an index. Diversification can help mitigate the risk and volatility in your portfolio but does not ensure a profit or guarantee against a loss.
Other Data Sources: Equity Market and Fixed Income returns are from JP Morgan as of 12/31/20. Rates and Economic Calendar Data from Bloomberg as of 12/31/20. International developed markets measured by the MSCI EAFE Index, emerging markets measured by the MSCI EM Index, U.S. Large Cap defined by the S&P 500. Sector performance is measured using GICS methodology. S&P 500 sector performance represents total return figures sourced from Bloomberg. All figures contained in all data tables was sourced from Morningstar as of 12/28/20.
Diversification can help mitigate the risk and volatility in your portfolio but does not ensure a profit or guarantee against loss.
Investing in commodities is not suitable for all investors. Exposure to the commodities markets may subject an investment to greater share price volatility than an investment in traditional equity or debt securities. Investments in commodities may be affected by changes in overall market movements, commodity index volatility, changes in interest rates or factors affecting a particular industry or commodity.
Products that invest in commodities may employ more complex strategies which may expose investors to additional risks.
Investing in fixed income securities involves certain risks such as market risk if sold prior to maturity and credit risk especially if investing in high yield bonds, which have lower ratings and are subject to greater volatility. All fixed income investments may be worth less than the original cost upon redemption or maturity. Bond Prices fluctuate inversely to changes in interest rates. Therefore, a general rise in interest rates can result in the decline of the value of your investment.
Definitions
MSCI- EAFE: The Morgan Stanley Capital International Europe, Australasia and Far East Index, a free float-adjusted market capitalization index that is designed to measure developed-market equity performance, excluding the United States and Canada.
MSCI-Emerging Markets: The Morgan Stanley Capital International Emerging Market Index, is a free float-adjusted market capitalization index that is designed to measure the performance of global emerging markets of about 25 emerging economies.
Russell 3000: The Russell 3000 measures the performance of the 3000 largest US companies based on total market capitalization and represents about 98% of the investible US Equity market.
ML BOFA US Corp Mstr [Merill Lynch US Corporate Master]: The Merrill Lynch Corporate Master Market Index is a statistical composite tracking the performance of the entire US corporate bond market over time.
ML Muni Master [Merill Lynch US Corporate Master]: The Merrill Lynch Municipal Bond Master Index is a broad measure of the municipal fixed income market.
Investors cannot directly purchase any index.
LIBOR, London Interbank Offered Rate, is the rate of interest at which banks offer to lend money to one another in the wholesale money markets in London.
The Dow Jones Industrial Average is an unweighted index of 30 “blue-chip” industrial U.S. stocks.
The S&P Midcap 400 Index is a capitalization-weighted index measuring the performance of the mid-range sector of the U.S. stock market and represents approximately 7% of the total market value of U.S. equities. Companies in the Index fall between S&P 500 Index and the S&P SmallCap 600 Index in size: between $1-4 billion.
DJ Equity REIT Index represents all publicly traded real estate investment trusts in the Dow Jones U.S. stock universe classified as Equity REITs according to the S&P Dow Jones Indices REIT Industry Classification Hierarchy. These companies are REITs that primarily own and operate income-producing real estate.

