Last Week’s Markets in Review: Consumers Remain Resilient
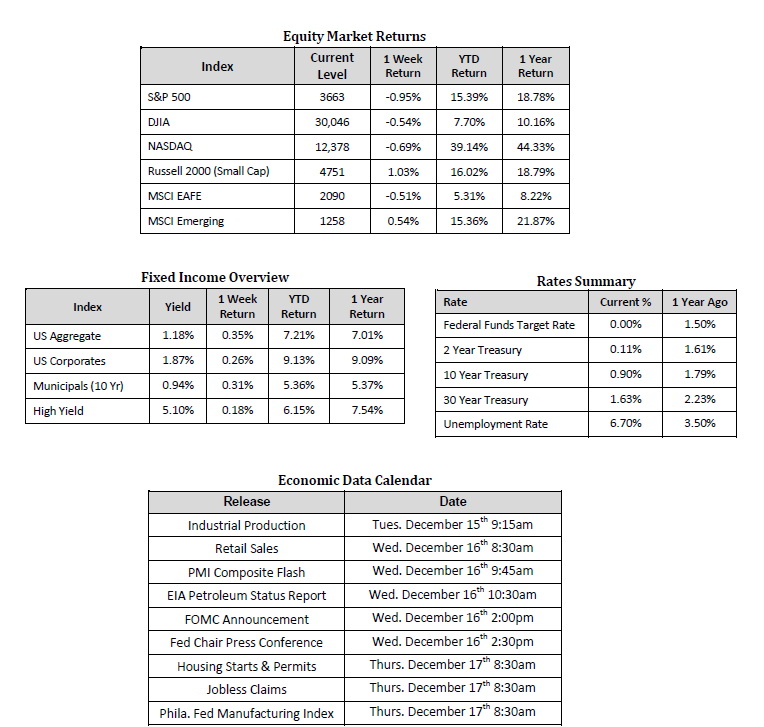
The market rally was put on pause last week as major indexes in the U.S. retreated from recent highs. The S&P 500 Index fell to a level of 3,663, representing a loss of 0.95%, while the Russell Midcap Index moved 0.46% lower last week. Meanwhile, the Russell 2000 Index, a measure of the Nation’s smallest publicly traded firms, continued it’s impressive run this quarter advancing 1.03% over the week. International equities were mixed as developed and emerging markets returned -0.51% and 0.54%, respectively. Finally, the yield on the 10-year U.S. Treasury moved lower, finishing the week at 0.90%, down 7 basis points from the week prior.
Here in northern New Jersey, our first snow occurred last week, a stark reminder that winter is upon us. As asset managers, ’tis the season to spotlight the American consumer during the shopping season, which seemingly gets earlier and earlier each year. We’re able to review data that provides insight into the health of the U.S. consumer, which is meaningful given that consumer spending accounts for approximately 70% of gross domestic product (GDP). We’ve marveled about the continued growth of online shopping and the entire e-commerce ecosystem, which did not disappoint this year. Take Cyber Monday, for example. According to Adobe, shoppers spent $10.8 billion on Cyber Monday, up 15.1% from a year ago. The volume represented the most extensive online shopping day ever. While many Americans continue to struggle with the hardships brought on by COVID-19, it is encouraging that consumers are still spending and continue to show resilience. This resilience was further evidenced by The University of Michigan’s consumer sentiment index, which rose in the December preliminary report, against consensus expectations calling for a modest decline.
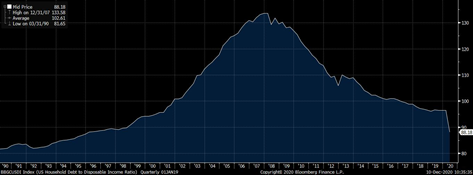
Furthermore, we find ourselves in a unique situation where consumer balance sheets appear relatively healthy compared to historical averages based on certain metrics. U.S. household debt compared to disposable income has dropped to levels not seen since the 1990s. Household Debt as a percentage of GDP is a similar story, even after factoring in the impact of the COVID-19 pandemic on GDP this year. So while sovereign debt increases, households appear to have become more fiscally prudent.
This prudence has taken place while the unemployment rate in the U.S. is currently at 6.7%, far from the 3%-4% band we were in before the pandemic. However, the story isn’t without some concerning metrics. Last week’s jobs report on Thursday showed the number filing for unemployment benefits jumped more than anticipated to 853,000, after multiple weeks in the 700,000s. Employment and personal income levels remain the most significant risks to the consumer in our view.
Nevertheless, with the prospect of a viable vaccine widely distributable in 2021 along with another round of fiscal aid, which is currently being negotiated by Congress, we remain optimistic as we head into next year. Low household debt levels, increased savings, and pent-up demand for areas impacted by COVID-19, such as services, entertainment, and travel, is a potential catalyst that could fuel economic growth once virus effects slowly subside.
As always, we continue to encourage investors to stay disciplined and work with experienced financial professionals to help manage their portfolios through various market cycles within an appropriately diversified framework that is consistent with their objectives, time-frame, and risk tolerance.
Sources for data in tables: Equity Market and Fixed Income returns are from JP Morgan as of 12/11/20. Rates and Economic Calendar Data from Bloomberg as of 12/11/20. International developed markets measured by the MSCI EAFE Index, emerging markets measured by the MSCI EM Index, U.S. Large Cap defined by the S&P 500. Sector performance is measured using the GICS methodology.
Diversification can help mitigate the risk and volatility in your portfolio but does not ensure a profit or guarantee against loss.
Investing in commodities is not suitable for all investors. Exposure to the commodities markets may subject an investment to greater share price volatility than an investment in traditional equity or debt securities. Investments in commodities may be affected by changes in overall market movements, commodity index volatility, changes in interest rates or factors affecting a particular industry or commodity.
Products that invest in commodities may employ more complex strategies which may expose investors to additional risks.
Investing in fixed income securities involves certain risks such as market risk if sold prior to maturity and credit risk especially if investing in high yield bonds, which have lower ratings and are subject to greater volatility. All fixed income investments may be worth less than the original cost upon redemption or maturity. Bond Prices fluctuate inversely to changes in interest rates. Therefore, a general rise in interest rates can result in the decline of the value of your investment.
Definitions
MSCI- EAFE: The Morgan Stanley Capital International Europe, Australasia and Far East Index, a free float-adjusted market capitalization index that is designed to measure developed-market equity performance, excluding the United States and Canada.
MSCI-Emerging Markets: The Morgan Stanley Capital International Emerging Market Index, is a free float-adjusted market capitalization index that is designed to measure the performance of global emerging markets of about 25 emerging economies.
Russell 3000: The Russell 3000 measures the performance of the 3000 largest US companies based on total market capitalization and represents about 98% of the investible US Equity market.
ML BOFA US Corp Mstr [Merill Lynch US Corporate Master]: The Merrill Lynch Corporate Master Market Index is a statistical composite tracking the performance of the entire US corporate bond market over time.
ML Muni Master [Merill Lynch US Corporate Master]: The Merrill Lynch Municipal Bond Master Index is a broad measure of the municipal fixed income market.
Investors cannot directly purchase any index.
LIBOR, London Interbank Offered Rate, is the rate of interest at which banks offer to lend money to one another in the wholesale money markets in London.
The Dow Jones Industrial Average is an unweighted index of 30 “blue-chip” industrial U.S. stocks.
The S&P Midcap 400 Index is a capitalization-weighted index measuring the performance of the mid-range sector of the U.S. stock market and represents approximately 7% of the total market value of U.S. equities. Companies in the Index fall between S&P 500 Index and the S&P SmallCap 600 Index in size: between $1-4 billion.
DJ Equity REIT Index represents all publicly traded real estate investment trusts in the Dow Jones U.S. stock universe classified as Equity REITs according to the S&P Dow Jones Indices REIT Industry Classification Hierarchy. These companies are REITs that primarily own and operate income-producing real estate.