Last Week’s Markets in Review: Does Negative Q1 GDP Point to a Recession?

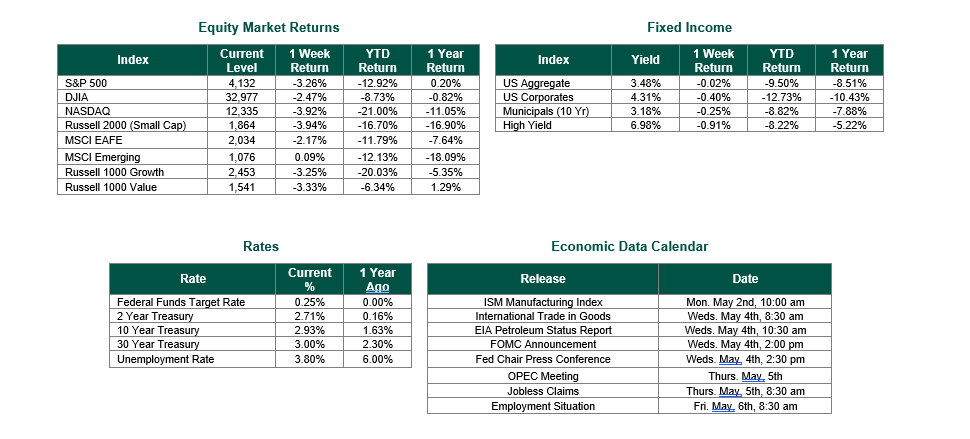
Global equity markets finished lower for the week. In the U.S., the S&P 500 Index closed the week at a level of 4,132, representing a decline of 3.26%, while the Russell Midcap Index moved -3.22% lower last week. Meanwhile, the Russell 2000 Index, a measure of the Nation’s smallest publicly traded firms, returned -3.94% over the week. International equity performance were mixed as developed and emerging markets returned -2.17% and 0.09%, respectively. Finally, the 10-year U.S. Treasury yield moved higher, closing the week at 2.93%.
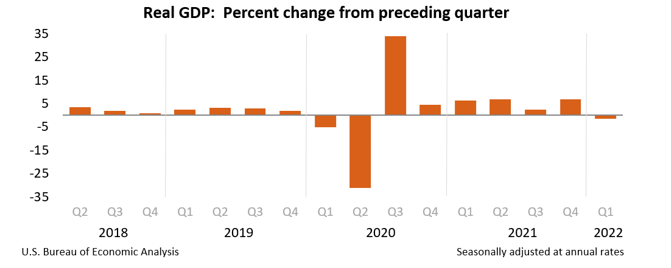
Unexpectedly, the U.S. Commerce Department reported that the initial reading of first-quarter gross domestic product (GDP), which measures the total market value of the goods and services produced by the economy, had fallen at a 1.4% annualized rate. Consensus estimates leading up to the data release projected a 1% increase. The actual results represented a shocking 2.4% miss in expectations. One of the more interesting facts about this figure is not necessarily the level of the decline, but rather that it comes on the heels of the 6.9% growth rate achieved in the 4th quarter of 2021, one of the strongest GDP releases in over three decades.

The GDP figures can be broken down to help us better understand what exactly caused the reversal in economic growth. A key difference between the phenomenal growth in Q4 2021 and the decline in Q1 2022 is the change in private inventories, which was responsible for a negative 0.84% of the overall GDP reading. Historically, negative private inventories have been a leading indicator of recessionary environments as the data suggests that firms have lower confidence in future sales and choose to draw down on their inventories as a result.
In addition to the drop in private inventories, it is also important to note a significant increase in imports leading to an increased current account deficit (exports minus imports). The United States economy has typically been a net importing nation, and the first quarter of 2022 was no exception, albeit to a larger extent. Over the past quarter, this surge in imports can likely be attributed to pandemic-related supply chain constraints and lower exports to weaker foreign economic activity. Regardless, the large increase in imports and decline in exports attributed to 3.2% of the overall drop in GDP.
Typically, the drop in inventories and increasing current account deficit would be worrisome to markets. Another quarter of similar results would put the U.S. economy in a recession, based on the widely-accepted definition of a recession as being two consecutive quarters of negative GDP growth. However, it would be unwise for us to predict a recession at this time without considering the entire economic picture. Despite the negatives, consumer spending was strong in Q1, rising 2.7% across the quarter despite a 7.8% increase in prices. Business spending also increased over the quarter as companies continued to invest in equipment and intellectual property products.
In conclusion, while the headline data appears to be worrisome, the underlying fundamentals of the U.S. economy continue to remain relatively strong. Markets initially reacted favorably to the GDP report, with the S&P 500 index closing last Thursday up 2.47% post announcement, the second-largest daily gain of 2022, before significantly falling on Friday. GDP is one of the most important macroeconomic metrics for investors to focus on, but it should not be the only data point considered when making investment decisions. For these reasons, we suggest working with financial professionals to determine how these economic figures may affect your portfolio and ensure that allocations are built according to risk tolerance, time horizon, and overall investment objectives.
Best wishes for the week ahead!
Equity Market and Fixed Income returns are from JP Morgan as of 4/29/22. Rates and Economic Calendar Data from Bloomberg as of 4/29/22. Seasonally adjusted Real GDP chart sourced from U.S. Bureau of Economic Analysis. International developed markets measured by the MSCI EAFE Index, emerging markets measured by the MSCI EM Index, U.S. Large Cap defined by the S&P 500. Sector performance is measured using the GICS methodology.
Disclosures: Past performance does not guarantee future results. We have taken this information from sources that we believe to be reliable and accurate. Hennion and Walsh cannot guarantee the accuracy of said information and cannot be held liable. You cannot invest directly in an index. Diversification can help mitigate the risk and volatility in your portfolio but does not ensure a profit or guarantee against a loss.
Diversification can help mitigate the risk and volatility in your portfolio but does not ensure a profit or guarantee against loss.
Investing in commodities is not suitable for all investors. Exposure to the commodities markets may subject an investment to greater share price volatility than an investment in traditional equity or debt securities. Investments in commodities may be affected by changes in overall market movements, commodity index volatility, changes in interest rates or factors affecting a particular industry or commodity.
Products that invest in commodities may employ more complex strategies which may expose investors to additional risks.
Investing in fixed income securities involves certain risks such as market risk if sold prior to maturity and credit risk, especially if investing in high yield bonds, which have lower ratings and are subject to greater volatility. All fixed income investments may be worth less than the original cost upon redemption or maturity. Bond Prices fluctuate inversely to changes in interest rates. Therefore, a general rise in interest rates can result in the decline of the value of your investment.
Definitions
MSCI- EAFE: The Morgan Stanley Capital International Europe, Australasia and Far East Index, a free float-adjusted market capitalization index that is designed to measure developed-market equity performance, excluding the United States and Canada.
MSCI-Emerging Markets: The Morgan Stanley Capital International Emerging Market Index, is a free float-adjusted market capitalization index that is designed to measure the performance of global emerging markets of about 25 emerging economies.
Russell 3000: The Russell 3000 measures the performance of the 3000 largest US companies based on total market capitalization and represents about 98% of the investible US Equity market.
ML BOFA US Corp Mstr [Merill Lynch US Corporate Master]: The Merrill Lynch Corporate Master Market Index is a statistical composite tracking the performance of the entire US corporate bond market over time.
ML Muni Master [Merill Lynch US Corporate Master]: The Merrill Lynch Municipal Bond Master Index is a broad measure of the municipal fixed income market.
Investors cannot directly purchase any index.
LIBOR, London Interbank Offered Rate, is the rate of interest at which banks offer to lend money to one another in the wholesale money markets in London.
The Dow Jones Industrial Average is an unweighted index of 30 “blue-chip” industrial U.S. stocks.
The S&P Midcap 400 Index is a capitalization-weighted index measuring the performance of the mid-range sector of the U.S. stock market and represents approximately 7% of the total market value of U.S. equities. Companies in the Index fall between S&P 500 Index and the S&P SmallCap 600 Index in size: between $1-4 billion.
DJ Equity REIT Index represents all publicly traded real estate investment trusts in the Dow Jones U.S. stock universe classified as Equity REITs according to the S&P Dow Jones Indices REIT Industry Classification Hierarchy. These companies are REITs that primarily own and operate income-producing real estate.


