Last Week’s Markets in Review: Economic Data Suggests More Growth is Ahead in 2021

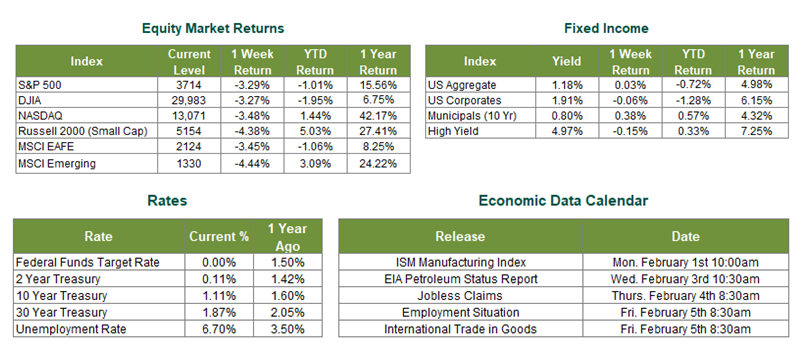
Global equity markets retreated during an exceptionally volatile week for stocks. In the U.S., the S&P 500 Index fell to a level of 3,714, representing a loss of 3.29%, while the Russell Midcap Index moved 4.09% lower last week. Meanwhile, the Russell 2000 Index, a measure of the Nation’s smallest publicly traded firms, returned -4.38% over the week, though still outpacing its larger-cap counterparts for the year. International equities were not immune to the declines as developed and emerging markets returned -3.45% and -4.44%, respectively. Finally, the 10-year U.S. Treasury yield settled in at 1.11%, roughly flat compared to the prior week.
Where do we even start unpacking everything that occurred during the last week of 2021’s opening month? It was a busy week for economic updates, quarterly earnings releases (as over 20% of the S&P 500 were scheduled to post Q4 results), and outtakes from the most recent Federal Open Market Committee (FOMC) meeting. Of course, there was also a continued rise in COVID-19 cases, vaccine updates, and news surrounding stimulus proposals for investors to digest last week. However, what seemingly garnered the most attention, within media outlets that is, was the speculative trading activity that drove prices through the roof in the likes of a retail gaming company and a particular movie theatre chain, for example, in an incredibly short period of time. It’s an ongoing story of retail investors, online communities, hedge funds, and “short-squeezes.” Interesting to say the least, however, certainly not an arena that we choose to get involved. Therefore, we will focus on what we believe were some of the more consequential economic releases from last week, as well as a brief update on the 4th quarter of 2020 earnings season.
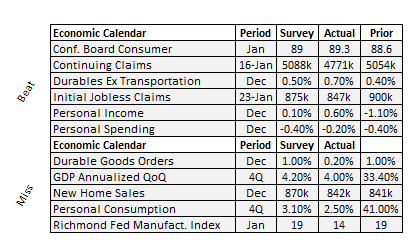
Starting with Gross Domestic Product (GDP), in the first reading for 4Q20 we saw a second consecutive quarter of economic expansion. The reported 4% growth rate came in just below consensus estimates of 4.2%. Reasons for the small “miss” is likely two-fold; 1) the increase of COVID-19 cases and associated impact on the labor market, and 2) a cool-down period from the robust economic growth that was reported for Q3. These factors may have decreased American’s propensity to spend in the final three months of the year, which is reflected in the personal consumption release last week that rose less than expected. Speaking of labor markets, initial jobless claims dipped back below 900k for the week. The 847,000 reported was less than the 875,000 expected by economists.

Recognizing that markets are forward-looking, we continue to monitor the underlying economic data to help identify future, potential market movements. As additional stimulus is negotiated and approved vaccine doses are being deployed, it’s important to recognize any indications contrary to a supportive environment and understand how different asset classes may be impacted. We are, in fact, in a time when uncertainty remains elevated while certain indices float around record highs. In such an environment, navigating the capital markets can be difficult.
S&P 500 company earnings and revenue “surprises” continue to come in at a rate higher than historical averages. According to FactSet, with 37% of the companies in the S&P 500 reporting actual results thus far for the 4th quarter of 2020, 82% of S&P 500 companies have reported a positive EPS surprise, and 76% have reported a positive revenue surprise. If the 82% beat rate holds, it will mark the second-highest percentage of S&P 500 companies reporting a positive EPS surprise since FactSet began tracking this data back in 2008.
However, these beat rates should be taken with somewhat of a grain of salt as overall earnings are still expected to be lower on a year-over-year basis. According to FactSet, the blended earnings decline for the S&P 500 Index in the 4th quarter of 2020 is expected to be -2.3%. A decrease in Q4 earnings would mark the fourth straight quarter in which the S&P 500 Index has reported a year-over-year decline in earnings – not entirely surprising given the brutal impact of the COVID-19 pandemic.
Perhaps even more critical than Q4 2020 earnings releases will be company officials’ forward-looking guidance for 2021. Thus far, little guidance has been provided as only eleven S&P 500 companies have issued negative EPS guidance, and twenty S&P 500 companies have issued positive EPS guidance for the 1st quarter of 2021. It would be hard to imagine that quarterly corporate earnings in 2021 will look anything but strong relative to the quarterly earnings reported during the COVID-19 stricken year of 2020.
We continue to encourage investors to work with experienced financial professionals to help manage their portfolios through various market cycles within an appropriately diversified framework that is consistent with their investment objectives, time-frame, and risk tolerance. Best wishes for the week ahead!
Sources for data in tables: Equity Market and Fixed Income returns are from JP Morgan as of 1/29/21. Rates and Economic Calendar Data from Bloomberg as of 1/29/21. International developed markets measured by the MSCI EAFE Index, emerging markets measured by the MSCI EM Index, U.S. Large Cap defined by the S&P 500. Sector performance is measured using the GICS methodology.
Disclosures: Past performance does not guarantee future results. We have taken this information from sources that we believe to be reliable and accurate. Hennion and Walsh cannot guarantee the accuracy of said information and cannot be held liable. You cannot invest directly in an index. Diversification can help mitigate the risk and volatility in your portfolio but does not ensure a profit or guarantee against a loss.
Diversification can help mitigate the risk and volatility in your portfolio but does not ensure a profit or guarantee against loss.
Investing in commodities is not suitable for all investors. Exposure to the commodities markets may subject an investment to greater share price volatility than an investment in traditional equity or debt securities. Investments in commodities may be affected by changes in overall market movements, commodity index volatility, changes in interest rates or factors affecting a particular industry or commodity.
Products that invest in commodities may employ more complex strategies which may expose investors to additional risks.
Investing in fixed income securities involves certain risks such as market risk if sold prior to maturity and credit risk especially if investing in high yield bonds, which have lower ratings and are subject to greater volatility. All fixed income investments may be worth less than the original cost upon redemption or maturity. Bond Prices fluctuate inversely to changes in interest rates. Therefore, a general rise in interest rates can result in the decline of the value of your investment.
Definitions
MSCI- EAFE: The Morgan Stanley Capital International Europe, Australasia and Far East Index, a free float-adjusted market capitalization index that is designed to measure developed-market equity performance, excluding the United States and Canada.
MSCI-Emerging Markets: The Morgan Stanley Capital International Emerging Market Index, is a free float-adjusted market capitalization index that is designed to measure the performance of global emerging markets of about 25 emerging economies.
Russell 3000: The Russell 3000 measures the performance of the 3000 largest US companies based on total market capitalization and represents about 98% of the investible US Equity market.
ML BOFA US Corp Mstr [Merill Lynch US Corporate Master]: The Merrill Lynch Corporate Master Market Index is a statistical composite tracking the performance of the entire US corporate bond market over time.
ML Muni Master [Merill Lynch US Corporate Master]: The Merrill Lynch Municipal Bond Master Index is a broad measure of the municipal fixed income market.
Investors cannot directly purchase any index.
LIBOR, London Interbank Offered Rate, is the rate of interest at which banks offer to lend money to one another in the wholesale money markets in London.
The Dow Jones Industrial Average is an unweighted index of 30 “blue-chip” industrial U.S. stocks.
The S&P Midcap 400 Index is a capitalization-weighted index measuring the performance of the mid-range sector of the U.S. stock market and represents approximately 7% of the total market value of U.S. equities. Companies in the Index fall between S&P 500 Index and the S&P SmallCap 600 Index in size: between $1-4 billion.
DJ Equity REIT Index represents all publicly traded real estate investment trusts in the Dow Jones U.S. stock universe classified as Equity REITs according to the S&P Dow Jones Indices REIT Industry Classification Hierarchy. These companies are REITs that primarily own and operate income-producing real estate.


