Last Week’s Markets in Review: Fed Hits Pause, Markets Fast Forward

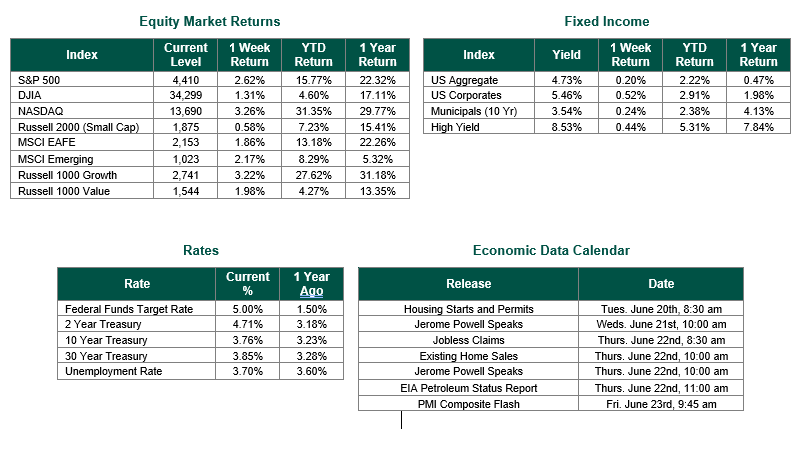
Global equity markets finished higher for the week. In the U.S., the S&P 500 Index closed the week at a level of 4,410, representing an increase of 2.62%, while the Russell Midcap Index moved 2.35% higher last week. Meanwhile, the Russell 2000 Index, a measure of the Nation’s smallest publicly traded firms, returned 0.58% over the week. As developed, international equity performance and emerging markets were higher, returning 1.86% and 2.17%, respectively. Finally, the 10-year U.S. Treasury yield moved higher, closing the week at 3.76%.
The momentum of the U.S. stock market continued last week as investors traded around the highly anticipated Federal Reserve interest rate decision. As expected, the Federal Open Market Committee (FOMC) announced that it would not raise interest rates for the first time since March 2022. However, what the market was not expecting was how “hawkish” this pause in rates would ultimately sound following the announcement. The rate decision was not a confirmation that the current hiking cycle had reached its peak but rather an expectation now that we could potentially see two more rate hikes before the end of 2023, given persistent inflationary pressures.
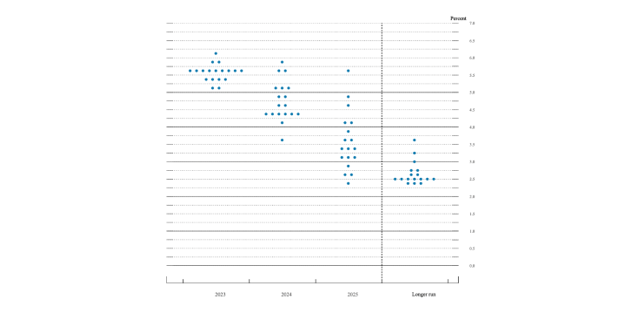
Markets would brush off the commentary by the Fed, as we saw in the strong performance of all major indices last week. Why has such hawkish rhetoric created a bullish outcome? Part of understanding why this phenomenon is occurring could lie within other economic data points. The reason for a pause is to assess the outcome of prior Fed monetary policy before deciding if it is necessary for future hikes despite the projections from officials that we saw within their Dot Plot Chart (as seen below). What we know today is that the Fed has held a consistent position that it is willing to do whatever it takes to get to its current 2% long-term inflation target.

Given the current landscape, the Fed can be comfortable with where their aggressive monetary policies have gotten them and be able to consider potentially pushing the goalpost even further. The labor markets remained resilient, with jobless claims for the week remaining unchanged at 262,000 even though this was slightly above the 248,000-consensus forecast. Additionally, Fed officials became more optimistic with their unemployment rate outlook, now standing at 4.1% vs. the 4.5% year-end expectation they had at their last meeting. Retail sales have also been resilient, expanding by 0.3% month over month, while consensus expectations were for a decline of 0.1%. All of this comes in addition to strong Consumer Price data we received last week that was 0.1% lower than consensus expectations on the month-over-month and year-over-year measurements. The largest contributor to increasing inflation was shelter data, which tends to have the greatest lag compared to other factors within the index. This lag gives the Fed an added buffer and reasoning for pause as they wait to see how the effects of lower shelter inflation will influence overall inflation. Whether the Fed raises one (or two) more times in 2023 or not, it is becoming clear that we are at (or very neat to) the end of this rate hike cycle and that interest rates will likely be lower over the next two years.
Investors should consider all the information discussed within this market update and many other factors when managing their investment portfolios. However, with so much data and so little time to digest, we encourage investors to work with experienced financial professionals to help process all this information to build and manage the asset allocations within their portfolios consistent with their objectives, timeframe, and tolerance for risk.
Best wishes for the week ahead!
Equity Market, Fixed Income returns, and rates are from Bloomberg as of 6/16/23. Dot Plot Chart from the Federal Reserve Board Economic Projection Release on 6/14/23. Consumer Pricing data from the BLS on 6/13/23. Retail Sales and Jobless Claims from the Department of Commerce and the U.S. Department of Labor, respectively, on 6/15/23. Economic Calendar Data from Econoday as of 6/20/23. International developed markets are measured by the MSCI EAFE Index, emerging markets are measured by the MSCI EM Index, and U.S. Large Caps are defined by the S&P 500 Index. Sector performance is measured using the GICS methodology.
Disclosures: Past performance does not guarantee future results. We have taken this information from sources that we believe to be reliable and accurate. Hennion and Walsh cannot guarantee the accuracy of said information and cannot be held liable. You cannot invest directly in an index. Diversification can help mitigate the risk and volatility in your portfolio but does not ensure a profit or guarantee against a loss.


