Last Week’s Markets in Review: GDP and Earnings Surprise to Upside

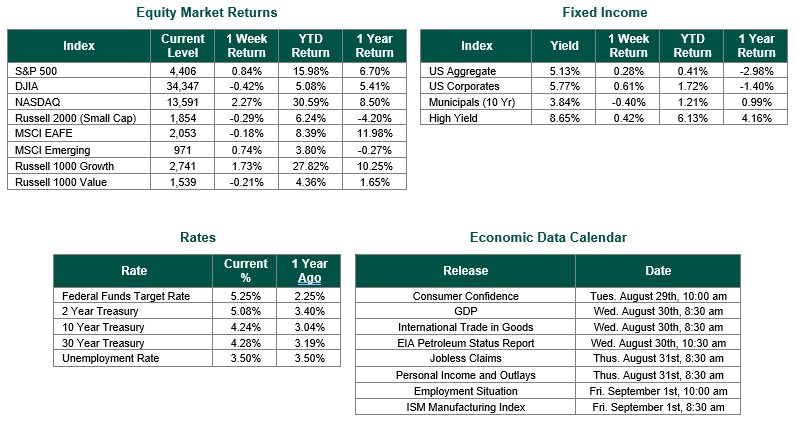
Global equity markets finished lower for the week. In the U.S., the S&P 500 Index closed the week at a level of 4,117, representing a decline of 2.52%, while the Russell Midcap Index moved -2.21% last week. Meanwhile, the Russell 2000 Index, a measure of the Nation’s smallest publicly traded firms, returned -2.60% over the week. As developed international equity performance and emerging markets were lower, returning -0.76% and -0.61%, respectively. Finally, the 10-year U.S. Treasury yield moved lower, closing the week at 4.83%.
Over the past week, events in the Middle East have been on most investors’ minds. Aside from the devastating human toll, the geopolitical risks are affecting all financial markets, and the potential escalation of the conflict between Israel and Hamas is impacting the global economy. Market participants were also paying close attention to domestic economic data last week. This data included reports on gross domestic product (GDP), durable goods orders, third-quarter corporate earnings, and the personal consumption expenditures (PCE) inflation measure.
Gross domestic product, a measure of all goods and services produced in the U.S., rose at a seasonally adjusted 4.9% annualized pace in the third quarter of 2023, up from a 2.1% pace in the second quarter, the Commerce Department reported last Thursday. The fresh GDP data, which exceeded economist expectations, reinforces other recent indicators of an economy that continues to show resilience against the Federal Reserve’s effort to slow the economy and cool inflation.
Similarly, orders for longer-lasting goods rose in September by more than expected, suggesting the outlook may be improving for U.S. manufacturers. The Commerce Department reported that new orders for durable goods rose 4.7% in September, compared to the consensus estimate of 2.0%.
Last Friday, we learned that the Federal Reserve’s preferred inflation gauge cooled slightly last month, according to data released by the Commerce Department. Excluding gas and food prices, the core Personal Consumption Expenditures (PCE) index rose 3.7% for the 12 months ended in September, down from the 3.8% rate seen in August. That represents the smallest year-over-year increase since the 3.2% annual rate seen in May 2021. On a monthly basis, it rose 0.3% from the 0.1% rate seen in August.
Throughout last week, third-quarter corporate earnings have also been a sign of a resilient economy. Utilizing data from FactSet as of October 27, 49% of companies within the S&P 500 have released earnings reports. At the mid-point of earnings season, both the number of positive earnings surprises and the magnitude of these earnings surprises are above their 10-year averages. Thus far, 78% of the companies that have announced third-quarter earnings have reported actual earnings per share above estimates. These results are above both the 5-year and 10-year averages. In aggregate, companies have reported earnings results that are 7.7% above estimates. In addition, according to FactSet, the blended year-over-year earnings growth rate for the S&P 500 index in Q3 is now 2.7%. If 2.7% is the actual growth rate for the quarter, it will mark the first quarter of year-over-year earnings growth reported by the S&P 500 index since Q3 2022.
Last week’s data was the final information the Federal Reserve will have to evaluate at its upcoming monetary policy meeting, which concludes on Thursday. Most market participants expect another pause in interest rate hikes from the Fed. We will be certain to report on the outtakes of the Fed’s November meeting in next week’s update.
Best wishes for the week ahead!
GDP, durable goods orders, and PCEI data are sourced from The Commerce Department. Corporate earnings are sourced from FactSet Equity Market, Fixed Income returns, and rates are from Bloomberg as of 10/27/23. Economic Calendar Data from Econoday as of 10/27/23. International developed markets are measured by the MSCI EAFE Index, emerging markets are measured by the MSCI EM Index, and U.S. Large Caps are defined by the S&P 500 Index. Sector performance is measured using the GICS methodology.
Disclosures: Past performance does not guarantee future results. We have taken this information from sources that we believe to be reliable and accurate. Hennion and Walsh cannot guarantee the accuracy of said information and cannot be held liable. You cannot invest directly in an index. Diversification can help mitigate the risk and volatility in your portfolio but does not ensure a profit or guarantee against a loss.


