Last Week’s Markets in Review: GDP and its Importance to Markets
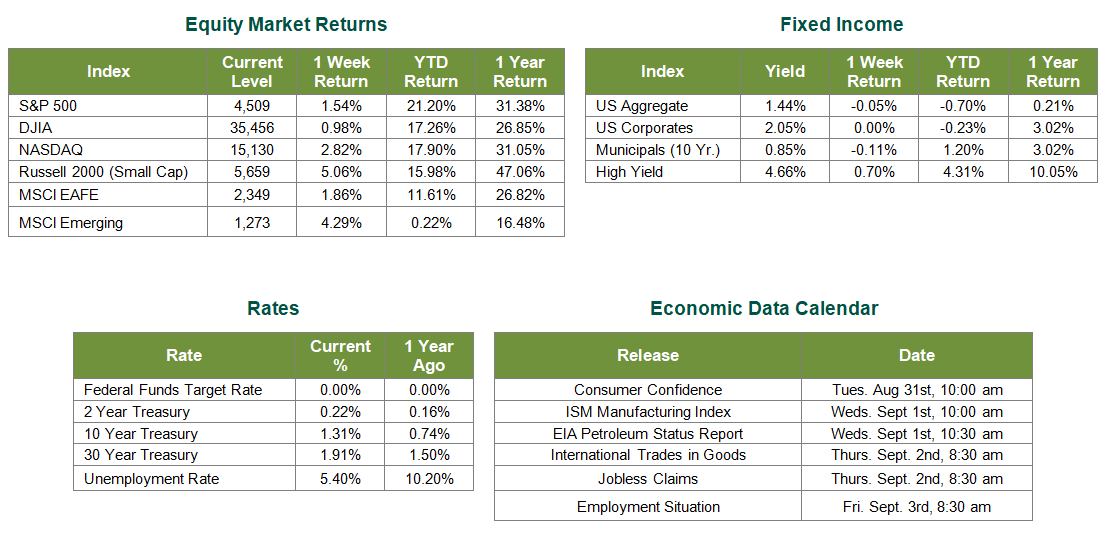
Global equity markets finished higher for the week. In the U.S., the S&P 500 Index reached record highs during midweek sessions but closed the week at a level of 4,509, representing a gain of 1.54%, while the Russell Midcap Index moved 3.01% higher last week. Meanwhile, the Russell 2000 Index, a measure of the Nation’s smallest publicly traded firms, returned 5.06% over the week. International equity performance rebounded as developed, and emerging markets returned -1.86% and 4.29%. Finally, the 10-year U.S. Treasury yield ticked higher, closing the week at 1.31%.
This past week has provided a plethora of key economic data that will be digested heavily by investors and analysts in both equity and fixed income markets. Of the data released, no metric may be more important than the gross domestic product (GDP) updates for the second quarter of 2021 released on Thursday. We hear and read about GDP all the time, but many retail investors tend to ask, “what exactly is GDP and why is it important to my portfolio?” In this week’s commentary, we will directly answer both of these questions.
What is GDP? GDP or gross domestic product is the all-inclusive measure of total economic activity. Within this all-inclusive measure there are 4 components:
1. Consumption – this is the largest contributor to GDP in the U.S. and consists of personal spending on both durable and non-durable goods as well as services such as banking, healthcare and education.
2. Business investment – consists of the money that is expensed by businesses to produce the goods that they sell.
3. Government Spending – the money spent by governments to help fund and stimulate the public sector through federal, state and local government. The largest component of government spending is currently allocated to the military in the United States.
4. Imports and Exports – this figure is calculated as a net figure on exports. The two figures have opposite effects on GDP, imports decrease GDP while exports will increase it.
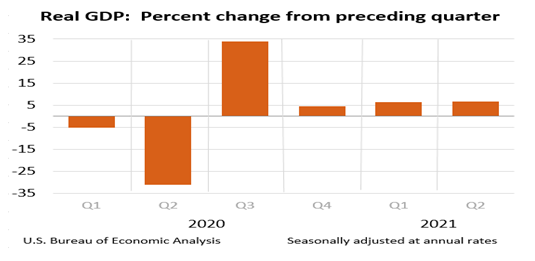
Each of these components of the GDP calculation plays an important role in providing investors with immense amounts of information pertaining to trends in the country’s economy. During Q2 of 2021, U.S. GDP increased at an annualized rate of 6.6% as compared to a 6.3% increase in Q1. This data release indicates a continued strong response by the U.S. economy in its recovery from COVID-19. The chart below from the Bureau of Economic Analysis provides a great visualization of the United State’s recovery in GDP since the first quarter of 2020.
So why does the GDP metric play such an important role in investors’ decisions in both the stock and bond markets? The answer is actually quite simple. By dissecting each of the components of GDP that we mentioned earlier, money managers can evaluate different trends in the overall economy to help them make better decisions. For example, if consumption (consumer spending) increases more significantly than expected, investors can be more confident in stronger corporate earnings in areas of higher consumption. More generally, higher than expected GDP readings will result in stronger corporate earnings, leading to higher potential equity returns. Conversely, when growth occurs more rapidly than expected, bond prices will typically tend to fall.
While GDP metrics are very important for investors to pay attention to, it is still just one of the many factors that investors should be taking into consideration when making investment decisions. As always, we suggest speaking with financial professionals to determine appropriate asset allocations in association with financial goals, risk, time horizon and liquidity needs.
Sources for data in tables: Consumer Price Index statistics are from the U.S. Department of Labor. Equity Market and Fixed Income returns are from JP Morgan as of 8/27/21. Rates and Economic Calendar Data from Bloomberg as of 8/27/21. International developed markets measured by the MSCI EAFE Index, emerging markets measured by the MSCI EM Index, U.S. Large Cap defined by the S&P 500. Sector performance is measured using the GICS methodology.
Disclosures: Past performance does not guarantee future results. We have taken this information from sources that we believe to be reliable and accurate. Hennion and Walsh cannot guarantee the accuracy of said information and cannot be held liable. You cannot invest directly in an index. Diversification can help mitigate the risk and volatility in your portfolio but does not ensure a profit or guarantee against a loss.
Diversification can help mitigate the risk and volatility in your portfolio but does not ensure a profit or guarantee against loss.
Investing in commodities is not suitable for all investors. Exposure to the commodities markets may subject an investment to greater share price volatility than an investment in traditional equity or debt securities. Investments in commodities may be affected by changes in overall market movements, commodity index volatility, changes in interest rates or factors affecting a particular industry or commodity.
Products that invest in commodities may employ more complex strategies which may expose investors to additional risks.
Investing in fixed income securities involves certain risks such as market risk if sold prior to maturity and credit risk especially if investing in high yield bonds, which have lower ratings and are subject to greater volatility. All fixed income investments may be worth less than the original cost upon redemption or maturity. Bond Prices fluctuate inversely to changes in interest rates. Therefore, a general rise in interest rates can result in the decline of the value of your investment.
Definitions
MSCI- EAFE: The Morgan Stanley Capital International Europe, Australasia and Far East Index, a free float-adjusted market capitalization index that is designed to measure developed-market equity performance, excluding the United States and Canada.
MSCI-Emerging Markets: The Morgan Stanley Capital International Emerging Market Index, is a free float-adjusted market capitalization index that is designed to measure the performance of global emerging markets of about 25 emerging economies.
Russell 3000: The Russell 3000 measures the performance of the 3000 largest US companies based on total market capitalization and represents about 98% of the investible US Equity market.
ML BOFA US Corp Mstr [Merill Lynch US Corporate Master]: The Merrill Lynch Corporate Master Market Index is a statistical composite tracking the performance of the entire US corporate bond market over time.
ML Muni Master [Merill Lynch US Corporate Master]: The Merrill Lynch Municipal Bond Master Index is a broad measure of the municipal fixed income market.
Investors cannot directly purchase any index.
LIBOR, London Interbank Offered Rate, is the rate of interest at which banks offer to lend money to one another in the wholesale money markets in London.
The Dow Jones Industrial Average is an unweighted index of 30 “blue-chip” industrial U.S. stocks.
The S&P Midcap 400 Index is a capitalization-weighted index measuring the performance of the mid-range sector of the U.S. stock market, and represents approximately 7% of the total market value of U.S. equities. Companies in the Index fall between S&P 500 Index and the S&P SmallCap 600 Index in size: between $1-4 billion.
DJ Equity REIT Index represents all publicly traded real estate investment trusts in the Dow Jones U.S. stock universe classified as Equity REITs according to the S&P Dow Jones Indices REIT Industry Classification Hierarchy. These companies are REITs that primarily own and operate income-producing real estate.