Last Week’s Markets in Review: Incorporating Growth and Value Stocks into Portfolio Strategies

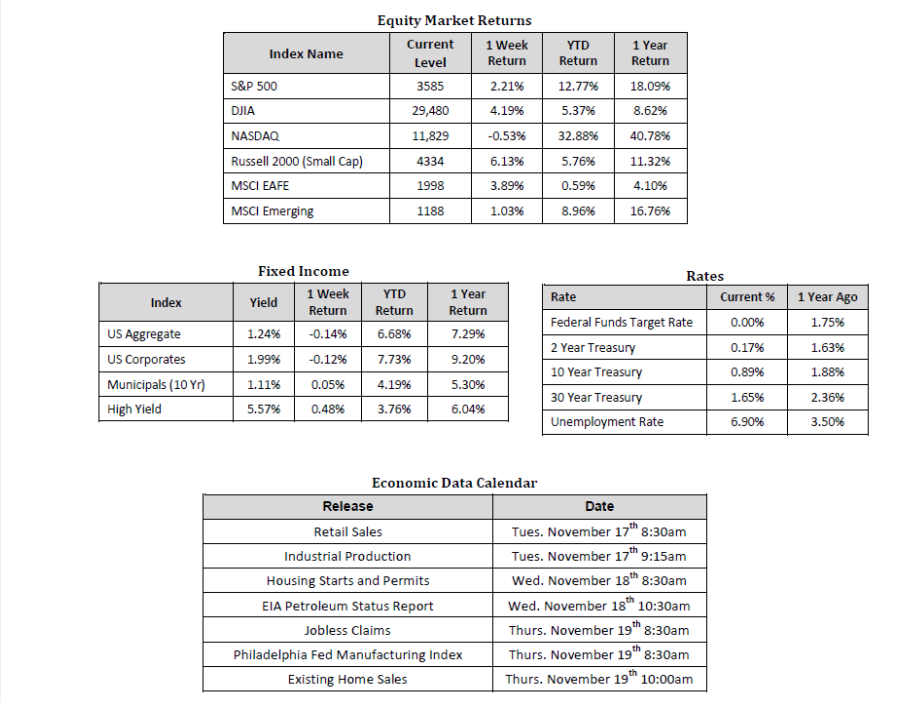
Stocks were mostly higher last week as positive vaccine news help lift stocks amid a spike in COVID-19 cases globally. In the U.S., the S&P 500 Index rose to a level of 3,585, representing a gain of 2.21%, while the Russell Midcap Index moved 3.22% higher last week. Meanwhile, the Russell 2000 Index, a measure of the Nation’s smallest publicly traded firms, increased 6.13% over the week. International equities also fared relatively well as developed and emerging markets returned 3.89% and 1.03%, respectively. Finally, the yield on the 10-year U.S. Treasury increased slightly, finishing the week at 0.89%, up 6 basis points from the week prior.
The biggest news last week came out of the healthcare sector as Pfizer and BioNTech announced results from a late-stage COVID-19 vaccine study that revealed a 90% efficacy rate in preventing the virus. Markets cheered at the prospect of a highly successful vaccine candidate. However, a rising tide didn’t necessarily lift all ships as investors focused on what a vaccine might indicate for the “stay-at-home” stocks that have performed so well throughout the pandemic. Throughout the week, there was a bit of a tug-of-war match going on between the so-called growth and value trades. The drivers of this oft-cited style-based rotation are less certain given the unprecedented nature of the COVID-19 pandemic and its unpredictable impact on particular asset markets. As a refresher, let’s first define what characteristics typically distinguish value and growth stocks.
Growth stocks are typically branded by certain characteristics. For example, higher valuation metrics such as price-to-earnings (P/E) ratios, which often suggests that investors are willing to pay a high price per dollar of earnings. This can be attributed to a company’s general industry, competitive advantage(s), and/or higher than average earnings and revenue growth, for example. Value stocks, on the other hand, tend to trade at lower prices compared to their fundamentals. They may even deploy cash differently, for example, in the form of dividend payments when growth driving expenditures may not be as abundant at their stage of the company lifecycle or in their respective industry.
With those two areas broadly defined, let’s now explore if there is a growth to value rotation taking place, or is one imminent in the near future based on trading patterns we’ve seen recently? Furthermore, are we entering the expansionary stage of the business cycle when value has historically outperformed? Unfortunately, we don’t think it’s necessarily that simple to answer these questions in this current market environment. COVID-19 threw a wrench into global economic activity and led the economy into a recession. Many believed the economic slowdown and subsequent recession was inevitable, however, the cause, pace, and magnitude were unforeseeable. Since the lows, we have found ourselves in limbo. The recovery from this particular recession is likely to be different from others given changed societal behaviors and lingering restrictions related to the coronavirus. For much of the year, the growth rally was driven by companies that were beneficiaries of a shift in behavior due to COVID-19. Sectors like technology and industries including e-commerce thrived. Traditional value sectors such as financials lagged. While the cause may be more tied to extreme interest rate suppression, it further perpetuated the growth over value narrative.
Now, with the prospect of an effective vaccine, perhaps we can start to evaluate the economy in a more traditional sense. We find ourselves in a situation where the economic backdrop is actually relatively strong. Corporate earnings and economic data continue to surprise to the upside, and the labor market appears to be moving in the right direction, though it will likely be years before we return to the 3.5% unemployment rate that the U.S. enjoyed as recently as March of this year. For the first time since the start of the pandemic, economists and analysts can begin to make supplemental forecasts that begin to remove the major variable of COVID-19. In fact, JP Morgan now sees the S&P 500 surpassing their earlier price target of 3,600 before year-end and reaching 4,000 by early next year.
Value stocks may be worthy of consideration as they tend to outperform early in the business cycle. However, value is often associated, though not exclusively, with those cyclical sectors that benefit from increased economic activity. In addition, the areas that benefit from the “reopening” of the economy that were previously suppressed have our attention. Value and higher beta sectors such as industrials, materials, financials, consumer discretionary, and small cap stocks have room to move. As a result, calling a growth to value rotation at this point may be a bit premature. While relative performance is debatable due to “lofty” tech valuations, there are more secular trends in play that speak to the aforementioned societal shifts. E-commerce activity, cloud services utilization, and cybersecurity demand aren’t going to decline anytime soon. As a result, we continue to see opportunities in growth oriented stocks, but are still mindful of other opportunities that should come about as the impact of COVID-19 slowly diminishes. Therefore, a more diversified approach may be worthy of consideration. Market performance will likely be driven less by just a few areas of the economy, as we’ve seen throughout much of 2020, but rather shared by areas that benefit from economic expansion and industries highly impacted from COVID-19 related lockdowns and restrictions.
Certain headwinds and uncertainties persist and it may remain increasingly difficult to identify growth and income opportunities in the months ahead. Accordingly, we continue to encourage investors to stay disciplined and work with experienced financial professionals to help manage their portfolios through various market cycles within an appropriately diversified framework that is consistent with their objectives, time-frame, and risk tolerance.
Sources for data in tables: Equity Market and Fixed Income returns are from JP Morgan as of 11/13/20. Rates and Economic Calendar Data from Bloomberg as of 11/13/20. International developed markets measured by the MSCI EAFE Index, emerging markets measured by the MSCI EM Index, U.S. Large Cap defined by the S&P 500. Sector performance is measured using the GICS methodology.
Diversification can help mitigate the risk and volatility in your portfolio but does not ensure a profit or guarantee against loss.
Investing in commodities is not suitable for all investors. Exposure to the commodities markets may subject an investment to greater share price volatility than an investment in traditional equity or debt securities. Investments in commodities may be affected by changes in overall market movements, commodity index volatility, changes in interest rates or factors affecting a particular industry or commodity.
Products that invest in commodities may employ more complex strategies which may expose investors to additional risks.
Investing in fixed income securities involves certain risks such as market risk if sold prior to maturity and credit risk especially if investing in high yield bonds, which have lower ratings and are subject to greater volatility. All fixed income investments may be worth less than the original cost upon redemption or maturity. Bond Prices fluctuate inversely to changes in interest rates. Therefore, a general rise in interest rates can result in the decline of the value of your investment.
Definitions
MSCI- EAFE: The Morgan Stanley Capital International Europe, Australasia and Far East Index, a free float-adjusted market capitalization index that is designed to measure developed-market equity performance, excluding the United States and Canada.
MSCI-Emerging Markets: The Morgan Stanley Capital International Emerging Market Index, is a free float-adjusted market capitalization index that is designed to measure the performance of global emerging markets of about 25 emerging economies.
Russell 3000: The Russell 3000 measures the performance of the 3000 largest US companies based on total market capitalization and represents about 98% of the investible US Equity market.
ML BOFA US Corp Mstr [Merill Lynch US Corporate Master]: The Merrill Lynch Corporate Master Market Index is a statistical composite tracking the performance of the entire US corporate bond market over time.
ML Muni Master [Merill Lynch US Corporate Master]: The Merrill Lynch Municipal Bond Master Index is a broad measure of the municipal fixed income market.
Investors cannot directly purchase any index.
LIBOR, London Interbank Offered Rate, is the rate of interest at which banks offer to lend money to one another in the wholesale money markets in London.
The Dow Jones Industrial Average is an unweighted index of 30 “blue-chip” industrial U.S. stocks.
The S&P Midcap 400 Index is a capitalization-weighted index measuring the performance of the mid-range sector of the U.S. stock market and represents approximately 7% of the total market value of U.S. equities. Companies in the Index fall between S&P 500 Index and the S&P SmallCap 600 Index in size: between $1-4 billion.
DJ Equity REIT Index represents all publicly traded real estate investment trusts in the Dow Jones U.S. stock universe classified as Equity REITs according to the S&P Dow Jones Indices REIT Industry Classification Hierarchy. These companies are REITs that primarily own and operate income-producing real estate.


