Last Week’s Markets in Review: Inflation Data Remains in Focus

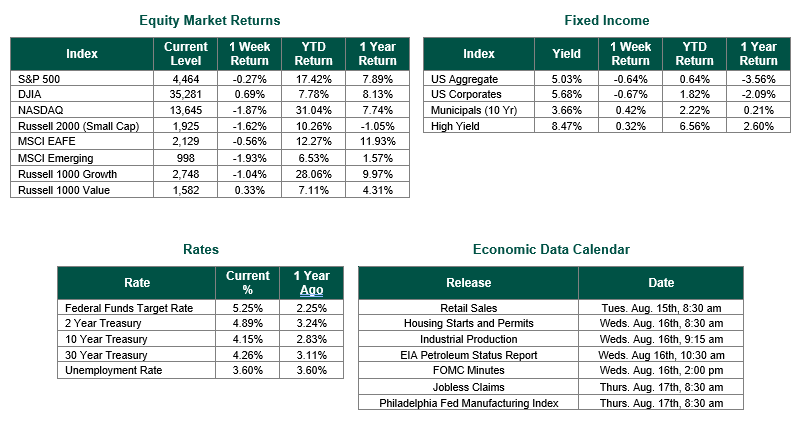
Global equity markets finished higher for the week. In the U.S., the S&P 500 Index closed the week at a level of 4,464, representing a decrease of 0.27%, while the Russell Midcap Index moved 0.87% lower last week. Meanwhile, the Russell 2000 Index, a measure of the Nation’s smallest publicly traded firms, returned -1.62% over the week. As developed international equity performance and emerging markets were lower, returning -0.56% and -1.93%, respectively. Finally, the 10-year U.S. Treasury yield moved higher, closing the week at 4.15%.
The old adage that Wall Street slows to a crawl in August seems to have been the case during the past week. With the reporting cycle for second-quarter corporate earnings nearly complete, there were no headlines that moved the market. Economic data was also sparse, with the exception of inflation data. During the week, investors were able to review both the Consumer Price Index (CPI) and Producer Price Index for the month of July.
Second-quarter corporate earnings were far better than investors’ expectations on average. FactSet reports that 79% of S&P 500 companies have reported a positive EPS surprise and 65% have reported a positive revenue surprise. This accounts for 84% of S&P 500 companies with a big week of retailers to report this week.
With very little other data to focus on the markets were anticipating the Thursday release of the July Consumer Price Index. CPI rose 3.2% from a year ago in July, slightly below expectation. The core CPI ran at a 12-month rate of 4.7%, also below the estimate. Both measures were up 0.2% on the month. Drilling down into the report, shelter costs rose 0.4% for July and 7.7% from a year ago accounting for almost all the overall increase. Real wages adjusted for inflation increased 0.3% on the month. Markets were encouraged that slowing inflation can affect the Fed’s future monetary policy.
On Friday, US wholesale inflation rose more than expected in July, reversing a yearlong cooling trend, the Bureau of Labor Statistics reported. The Producer Price Index, which tracks the average change in prices that businesses pay to suppliers, rose 0.8% annually. That was above June’s upwardly revised increase of 0.2% and higher than expectations for a 0.7% gain. The increased in the overall index can be traced to an increase in Services. The price of Services rose 0.5% from June, the highest monthly increase since March 2022. Markets viewed this data in a negative way.
We hope that everyone has a productive week ahead!
Corporate Earnings Data was sourced from FactSet. Consumer Price Index (CPI) and Producer Price Index for the month of July were sourced from the Bureau of Labor Statistics. Equity Market, Fixed Income returns, and rates are from Bloomberg as of 8/11/23. Economic Calendar Data from Econoday as of 8/11/23. International developed markets are measured by the MSCI EAFE Index, emerging markets are measured by the MSCI EM Index, and U.S. Large Caps are defined by the S&P 500 Index. Sector performance is measured using the GICS methodology.
Disclosures: Past performance does not guarantee future results. We have taken this information from sources that we believe to be reliable and accurate. Hennion and Walsh cannot guarantee the accuracy of said information and cannot be held liable. You cannot invest directly in an index. Diversification can help mitigate the risk and volatility in your portfolio but does not ensure a profit or guarantee against a loss.


