Last Week’s Markets in Review: Inflation Expectations and Investment Considerations
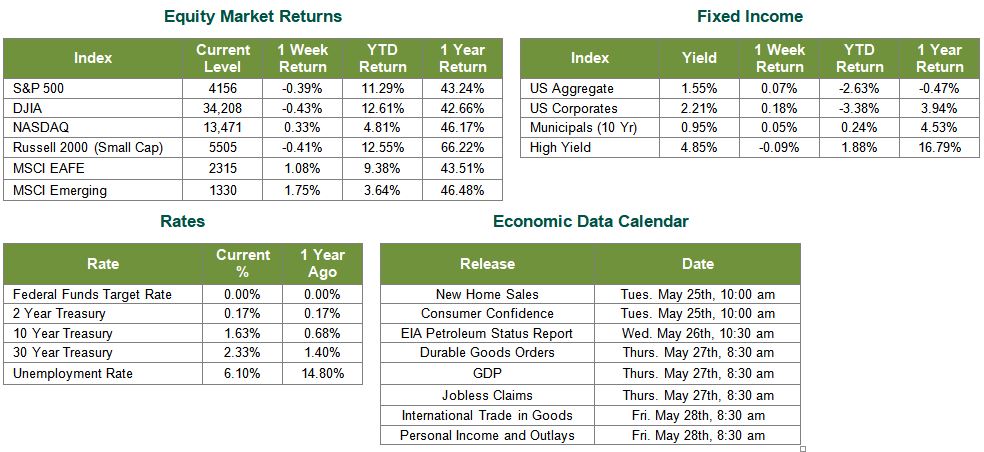
Global equity markets were mixed for the week. In the U.S., the S&P 500 Index (S&P 500) took a small step backwards closing the week at a level of 4,156, representing a loss of 0.39%, while the Russell Midcap Index moved 0.16% lower last week. Meanwhile, the Russell 2000 Index, a measure of the Nation’s smallest publicly traded firms, returned -0.41% over the week. International equity was positive as developed and emerging markets returned 1.08% and 1.75%, respectively. Finally, the 10-year U.S. Treasury yield was unchanged for the week, closing the week at 1.63%.
Markets can’t seem to shake the fear of a persistently high level of inflation and what that may mean for the economy and asset prices. Despite the insistence from the Federal Reserve (Fed) that the recent high consumer price index (CPI) reading is likely to be transient in nature, market participants continue to have their doubts. In this regard, it may be helpful to understand the factors that the Fed considers when assessing inflationary pressures and why certain of these factors may have led to such a high CPI reading in April.
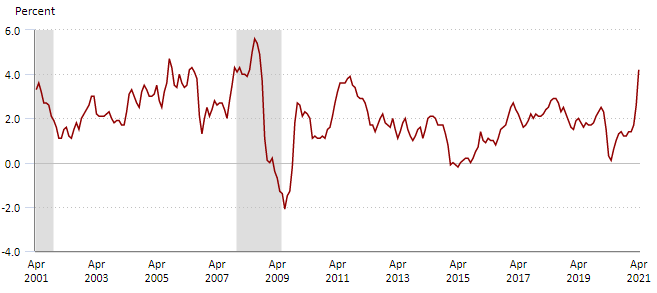
We have identified three critical dynamics in play that may have led to some biases in the recent CPI reading and support our current views on inflation – which is more in line with the Fed’s. First is the simple, oft-cited “base-effect.” CPI is calculated on a year-over-year basis, meaning that it compares to the same period of time last year, a time of meager inflation attributable to the unusual circumstances of a severely restricted economy by COVID-19. Starting from such a low base will inflate the current reading accordingly. We will see this impact in May’s reading, announced in June, and likely to a lesser extent, in June’s release as well.
Consumer Price Index (CPI) 12-Month Change
Source: U.S. Bureau of Labor Statistics
The second dynamic is related to the pace of economic reopening and the associated increase in spending overall. The imbalance of goods and services available compared to the flood of demand unleashed from reopenings across the country will increase prices. We expect supply and demand to normalize throughout the summer months. Finally, COVID-19 related supply chain bottlenecks in raw materials and imports also contribute to rising costs. Anyone making home improvements will know what we’re talking about, although the impact is even more widespread.
In all, according to the 5/18/21 SevensReport, airfare, used vehicle prices, and lodging prices all rose 10% in April. If those three areas, two impacted by the current pace of the economic reopenings and one by lingering semiconductor supply-chain issues, were removed, core CPI would have risen by just 0.4% on a month/month basis, less than half of the reported 0.9% increase. Hence, the surge in inflation we saw in April may indeed be transient in nature, but inflationary pressures, overall, will likely be present for the foreseeable future.
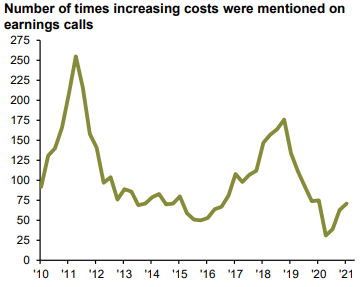
Furthermore, the graph below from JP Morgan shows the number of times increasing costs are mentioned during earnings calls this season.
The Fed, and the markets for that matter, will try and decipher to what degree these variables are temporary or perhaps more long-standing. It’s important to remember that reasonable levels of inflation tied to economic growth are healthy. Inflation and weak growth, on the other hand, are harmful. However, corporate earnings and forward guidance suggest that’s not the case. The Fed is trying to reflate the U.S. economy from the depths of despair realized during the initial stages of the COVID-19 pandemic. The Fed favors patience and an outcome-based approach that does not move too quickly and impedes economic growth progress. While we’re monitoring inflation and rate expectations, we continue to favor equities in general as the best potential hedge against inflation. In particular, we find specific areas of the equities market attractive during this stage of the economic cycle, such as cyclically sensitive sectors, which will also benefit from an expected increase in infrastructure spending. We also expect the growth to value rotation to continue and are bullish on certain growth-oriented industries, such as Biotech and Technology, but stress the need to be selective given the currently stretched valuations of many stocks.
As always, we encourage investors to stay disciplined and work with experienced financial professionals to help build and manage the asset allocations within their portfolios consistent with their objectives, timeframe, and tolerance for risk. Best wishes for the week ahead!
Sources for data in tables: Equity Market and Fixed Income returns are from JP Morgan as of 5/21/21. Rates and Economic Calendar Data from Bloomberg as of 5/21/21. International developed markets measured by the MSCI EAFE Index, emerging markets measured by the MSCI EM Index, U.S. Large Cap defined by the S&P 500. Sector performance is measured using the GICS methodology.
Disclosures: Past performance does not guarantee future results. We have taken this information from sources that we believe to be reliable and accurate. Hennion and Walsh cannot guarantee the accuracy of said information and cannot be held liable. You cannot invest directly in an index. Diversification can help mitigate the risk and volatility in your portfolio but does not ensure a profit or guarantee against a loss.
Diversification can help mitigate the risk and volatility in your portfolio but does not ensure a profit or guarantee against loss.
Investing in commodities is not suitable for all investors. Exposure to the commodities markets may subject an investment to greater share price volatility than an investment in traditional equity or debt securities. Investments in commodities may be affected by changes in overall market movements, commodity index volatility, changes in interest rates or factors affecting a particular industry or commodity.
Products that invest in commodities may employ more complex strategies which may expose investors to additional risks.
Investing in fixed income securities involves certain risks such as market risk if sold prior to maturity and credit risk especially if investing in high yield bonds, which have lower ratings and are subject to greater volatility. All fixed income investments may be worth less than the original cost upon redemption or maturity. Bond Prices fluctuate inversely to changes in interest rates. Therefore, a general rise in interest rates can result in the decline of the value of your investment.
Definitions
MSCI- EAFE: The Morgan Stanley Capital International Europe, Australasia and Far East Index, a free float-adjusted market capitalization index that is designed to measure developed-market equity performance, excluding the United States and Canada.
MSCI-Emerging Markets: The Morgan Stanley Capital International Emerging Market Index, is a free float-adjusted market capitalization index that is designed to measure the performance of global emerging markets of about 25 emerging economies.
Russell 3000: The Russell 3000 measures the performance of the 3000 largest US companies based on total market capitalization and represents about 98% of the investible US Equity market.
ML BOFA US Corp Mstr [Merill Lynch US Corporate Master]: The Merrill Lynch Corporate Master Market Index is a statistical composite tracking the performance of the entire US corporate bond market over time.
ML Muni Master [Merill Lynch US Corporate Master]: The Merrill Lynch Municipal Bond Master Index is a broad measure of the municipal fixed income market.
Investors cannot directly purchase any index.
LIBOR, London Interbank Offered Rate, is the rate of interest at which banks offer to lend money to one another in the wholesale money markets in London.
The Dow Jones Industrial Average is an unweighted index of 30 “blue-chip” industrial U.S. stocks.
The S&P Midcap 400 Index is a capitalization-weighted index measuring the performance of the mid-range sector of the U.S. stock market, and represents approximately 7% of the total market value of U.S. equities. Companies in the Index fall between S&P 500 Index and the S&P SmallCap 600 Index in size: between $1-4 billion.
DJ Equity REIT Index represents all publicly traded real estate investment trusts in the Dow Jones U.S. stock universe classified as Equity REITs according to the S&P Dow Jones Indices REIT Industry Classification Hierarchy. These companies are REITs that primarily own and operate income-producing real estate.
