Last Week’s Markets in Review: Is Now the Time to Consider Small-Cap Stocks?
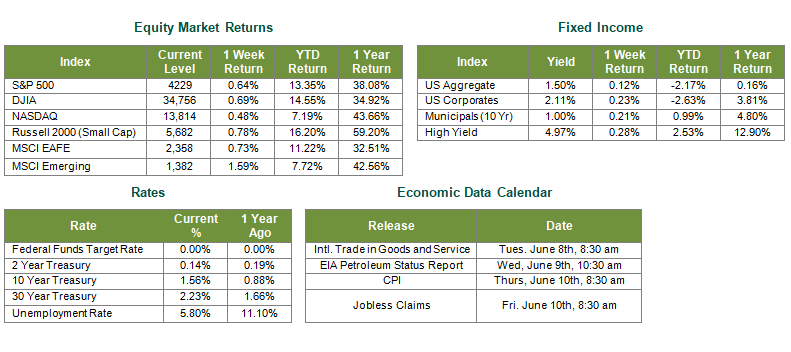
Global equity markets finished higher for the week. In the U.S., the S&P 500 Index (S&P 500) reached record highs and closed the week at a level of 4,229, representing a gain of 0.64%, while the Russell Midcap Index moved 0.56% higher last week. Meanwhile, the Russell 2000 Index, a measure of the Nation’s smallest publicly traded firms, returned 0.78% over the week. International equity performance was also positive as developed, and emerging markets returned 0.73% and 1.59%, respectively. Finally, the 10-year U.S. Treasury yield ticked lower, closing the week at 1.56%.
Regular readers of our weekly update will be familiar with the potential rotation trades that we’ve been monitoring and discussing throughout 2021. It’s helpful to review relative performance in this regard as we seek to identify market leadership and drivers of appreciation potential.
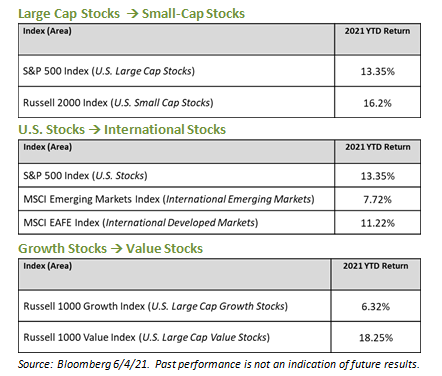
As you can see in the tables above, Value has experienced the most robust relative performance thus far this year. While we believe there are still several tailwinds in place to help provide further support for the Value rotation, investors should not dismiss the upside potential in international markets and the stocks of smaller-cap companies. These two areas are either outperforming their respective counterparts by a smaller margin or have yet to take over leadership year-to-date. We believe these areas are attractive investment considerations while noting that investors are typically under-allocated to small-cap stocks and international markets. In last week’s update, we discussed International Stocks, so we’ll further assess current opportunities that we see in small-cap stocks today.
Early last month, we dedicated a weekly update to “Assessing the Growth Potential of Small Companies.” As a quick refresher, in the midst of earnings season, we reminded investors that while large-cap companies were posting exceptional results overall, their smaller counterparts, which often don’t receive the same media attention, were releasing impressive numbers as well. In addition, tailwinds that support further upside potential for equity markets as a whole are perhaps even more pronounced within the small-cap space. At the same time, small-cap valuations, in general, are less stretched. In May, the smaller-cap Russell 2000 Index slightly underperformed the larger-cap S&P 500 Index. Despite the monthly performance, we continue to contend that certain smaller cap stocks look appealing over the short and long-term given the likelihood of solid earnings results as the economy continues to expand. In this regard, according to data from Goldman Sachs, the small-mid cap (SMID) asset class is expected to see earnings growth of 52% and 42% in 2021 and 2022, respectively.
In conclusion, we want to note the sizeable divergence between small-cap Growth and small-cap Value as Value has outperformed Growth by over 25% year-to-date. This divergence is not all too surprising as Growth tends to underperform in this stage of the economic cycle. However, we believe opportunities exist for certain small-cap growth-oriented industries, such as disruptive technologies within the information technology sector and biotechnology within the healthcare sector. For disruptive technologies, smaller companies are often the innovators that dedicate resources to research and development (R&D) and specialize in areas such as 5G, cybersecurity, and robotics, to name a few. In biotech, smaller companies continue to develop innovative healthcare solutions to meet the ongoing medical needs of society. While these companies may be attractive on their merit, we also notice when larger companies target these smaller cap innovators through mergers & acquisitions (M&A) to access their technologies and help expand their revenue streams.
As with other asset classes and security types, small-cap stocks have unique sets of risks that investors should understand before considering an investment. Accordingly, we encourage investors to work with experienced financial professionals to help build and manage the asset allocations within their portfolios consistent with their objectives, timeframe, and tolerance for risk. Best wishes for the week ahead!
Sources for data in tables: Equity Market and Fixed Income returns are from JP Morgan as of 6/4/21. Rates and Economic Calendar Data from Bloomberg as of 6/4/21. International developed markets measured by the MSCI EAFE Index, emerging markets measured by the MSCI EM Index, U.S. Large Cap defined by the S&P 500. Sector performance is measured using the GICS methodology.
Disclosures: Past performance does not guarantee future results. We have taken this information from sources that we believe to be reliable and accurate. Hennion and Walsh cannot guarantee the accuracy of said information and cannot be held liable. You cannot invest directly in an index. Diversification can help mitigate the risk and volatility in your portfolio but does not ensure a profit or guarantee against a loss.
Diversification can help mitigate the risk and volatility in your portfolio but does not ensure a profit or guarantee against loss.
Investing in commodities is not suitable for all investors. Exposure to the commodities markets may subject an investment to greater share price volatility than an investment in traditional equity or debt securities. Investments in commodities may be affected by changes in overall market movements, commodity index volatility, changes in interest rates or factors affecting a particular industry or commodity.
Products that invest in commodities may employ more complex strategies which may expose investors to additional risks.
Investing in fixed income securities involves certain risks such as market risk if sold prior to maturity and credit risk especially if investing in high yield bonds, which have lower ratings and are subject to greater volatility. All fixed income investments may be worth less than the original cost upon redemption or maturity. Bond Prices fluctuate inversely to changes in interest rates. Therefore, a general rise in interest rates can result in the decline of the value of your investment.
Definitions
MSCI- EAFE: The Morgan Stanley Capital International Europe, Australasia and Far East Index, a free float-adjusted market capitalization index that is designed to measure developed-market equity performance, excluding the United States and Canada.
MSCI-Emerging Markets: The Morgan Stanley Capital International Emerging Market Index, is a free float-adjusted market capitalization index that is designed to measure the performance of global emerging markets of about 25 emerging economies.
Russell 3000: The Russell 3000 measures the performance of the 3000 largest US companies based on total market capitalization and represents about 98% of the investible US Equity market.
ML BOFA US Corp Mstr [Merill Lynch US Corporate Master]: The Merrill Lynch Corporate Master Market Index is a statistical composite tracking the performance of the entire US corporate bond market over time.
ML Muni Master [Merill Lynch US Corporate Master]: The Merrill Lynch Municipal Bond Master Index is a broad measure of the municipal fixed income market.
Investors cannot directly purchase any index.
LIBOR, London Interbank Offered Rate, is the rate of interest at which banks offer to lend money to one another in the wholesale money markets in London.
The Dow Jones Industrial Average is an unweighted index of 30 “blue-chip” industrial U.S. stocks.
The S&P Midcap 400 Index is a capitalization-weighted index measuring the performance of the mid-range sector of the U.S. stock market, and represents approximately 7% of the total market value of U.S. equities. Companies in the Index fall between S&P 500 Index and the S&P SmallCap 600 Index in size: between $1-4 billion.
DJ Equity REIT Index represents all publicly traded real estate investment trusts in the Dow Jones U.S. stock universe classified as Equity REITs according to the S&P Dow Jones Indices REIT Industry Classification Hierarchy. These companies are REITs that primarily own and operate income-producing real estate.