Last Week’s Markets in Review: Jobs Data Impresses while COVID-19 Data Concerns

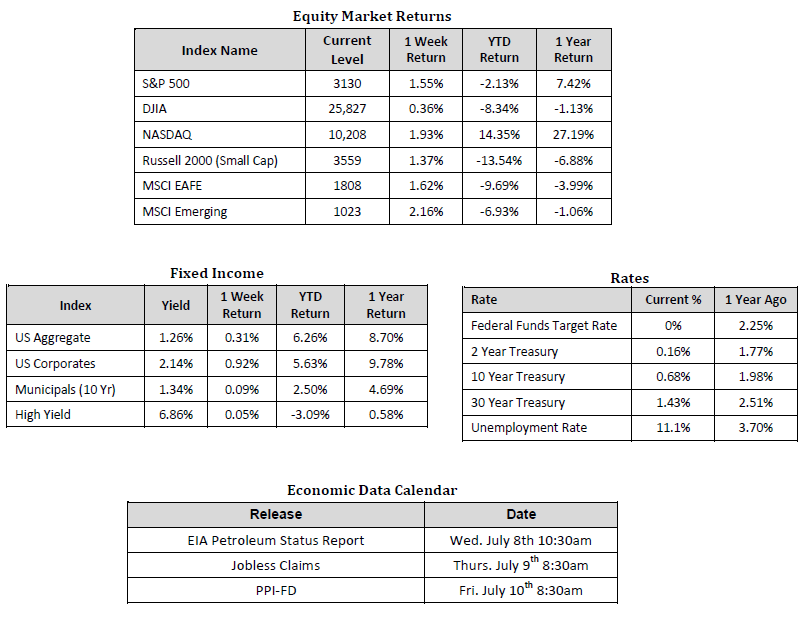
Global equity markets rallied following the release of a U.S. unemployment report that showed the rate of unemployed falling to 11.1%, much better than the consensus expectation of 12.4% unemployed, and 4.8 million in new jobs being created during the month of June. In the U.S., the S&P 500 Index rose to a level of 3,130, representing a gain of 1.55%, while the Russell Midcap Index pushed 3.71% higher last week. It’s also worth noting that the S&P 500 Index generated its strongest quarterly performance in 22 years, returning 20.54%, thanks in large part to the unprecedented stimulus measures put in place in response to the COVID-19 pandemic. Meanwhile, the Russell 2000 Index, a measure of the Nation’s smallest publicly traded firms, returned 1.37% over the week. Moreover, developed and emerging international markets returned 1.62% and 2.16%, respectively. Finally, the yield on the 10-year U.S. Treasury held firm, finishing the week at 0.68%.
Over the last few weeks, we’ve written about the growing dispersion between consensus expectations and the results ultimately reported, and this trend once again held true over the previous week. For instance, month-over-month growth in pending home sales increased by an astounding 44.4% in May against the expectation for a 19.3% increase. Meanwhile, the Dallas Fed Manufacturing Activity report was expected to fall to 21.4 in June but only fell to 6.1. Also, consider the all-important Conference Board Consumer Sentiment reading, which blew expectations out of the water and increased to 98.1 instead of 91.5 as many skilled forecasters expected. The list goes on and on, and the results are undeniably positive, yet nowhere near what was expected.
Now, if the waters weren’t murky enough to begin with, couple these favorable results with some concerning data points on the COVID-19 front that show an increase in infection rates in states like Florida, Texas, Arizona, and California and the near-term outlook is clouded even further. It is thus understandable that many investors find themselves confused with how best to position their portfolios for the months ahead. As students of the market, we understand that the most robust returns that can be had by an investor have historically been realized when uncertainty was at its highest point. For evidence, look no further than the exceptional 20.54% return generated by the S&P 500 through the 2nd quarter of 2020, all while most argued that equity markets were bound to re-test the lows reached in March. Thus, we continue to advocate the importance of remaining invested, even when collective confusion is palpable, and argue against what we believe can be misguided attempts at market timing that typically detract from longer-term performance.
One possible way to effectively maintain stock market exposure, while taking a slightly less aggressive stance, may be to consider allocating a portion of your stock exposure to an equity-oriented proxy such as Convertible Bonds. For those unfamiliar with Convertible Bonds, the performance of Convertible Bonds has shown about a 90% correlation to the performance of U.S. large cap stocks, which is why we believe that supplementing a portion of U.S. large cap exposure with a Convertible Bond strategy may help limit near-term downside risk, while also helping to capture upside movements in the stock market if U.S. equities continue to move higher. In an effort to validate this claim, we evaluate statistics such as the Bull Capture Ratio and the Bear Capture Ratio. These ratios indicate the percentage of positive, or negative, benchmark returns captured by the security in question. In this case, Convertible Bonds are the security in question, and the S&P 500 index is the benchmark, and what we find is that Convertible Bonds have produced a 96% Bull Capture Ratio and a 25% Bear Capture Ratio year-to-date (YTD) in 2020. Perhaps even more intriguing is that comparative YTD performance and drawdown characteristics portray Convertible Bonds in an even more favorable light. During the worst of the stock market rout in March, we witnessed the S&P 500 pullback by approximately 30%. In contrast, Convertible Bonds only fell ~26%, and the relative outperformance has continued YTD with Convertible Bonds registering a total return of 9.97% (as of 6/30/2020) compared to the S&P 500’s -3.09% total return over the same timeframe.
While we believe that Convertible Bonds can serve a useful role in helping to reduce risk in a portfolio that may otherwise only contain stocks, we also understand that this investment class may not be appropriate for everyone. For this reason, we encourage investors to stay disciplined and work with experienced financial professionals to help manage their portfolios through various market cycles within an appropriately diversified framework that is consistent with their objectives, time-frame, and tolerance for risk.
We recognize that these are very troubling and uncertain times, and we want you to know that we are always here to help in any way we can. Please stay safe and stay well.
Sources for data in tables: Equity Market and Fixed Income returns are from JP Morgan as of 07/02/20. Rates and Economic Calendar Data from Bloomberg as of 07/02/20. International developed markets measured by the MSCI EAFE Index, emerging markets measured by the MSCI EM Index, U.S. Large Cap defined by the S&P 500. Sector performance is measured using GICS methodology.
Important Information and Disclaimers
Disclosures: Past performance does not guarantee future results. We have taken this information from sources that we believe to be reliable and accurate. Hennion and Walsh cannot guarantee the accuracy of said information and cannot be held liable. You cannot invest directly in an index. Diversification can help mitigate the risk and volatility in your portfolio but does not ensure a profit or guarantee against loss. Hennion & Walsh is the sponsor of SmartTrust® Unit Investment Trusts (UITs). For more information on SmartTrust® UITs, please visit www.smarttrustuit.com. The overview above is for informational purposes and is not an offer to sell or a solicitation of an offer to buy any SmartTrust® UITs. Investors should consider the Trust’s investment objective, risks, charges and expenses carefully before investing. The prospectus contains this and other information relevant to an investment in the Trust and investors should read the prospectus carefully before they invest.
Investing in foreign securities presents certain risks not associated with domestic investments, such as currency fluctuation, political and economic instability, and different accounting standards. This may result in greater share price volatility. These risks are heightened in emerging markets.
There are special risks associated with an investment in real estate, including credit risk, interest rate fluctuations and the impact of varied economic conditions. Distributions from REIT investments are taxed at the owner’s tax bracket.
The prices of small company and mid-cap stocks are generally more volatile than large company stocks. They often involve higher risks because smaller companies may lack the management expertise, financial resources, product diversification and competitive strengths to endure adverse economic conditions.
Investing in commodities is not suitable for all investors. Exposure to the commodities markets may subject an investment to greater share price volatility than an investment in traditional equity or debt securities. Investments in commodities may be affected by changes in overall market movements, commodity index volatility, changes in interest rates or factors affecting a particular industry or commodity.
Products that invest in commodities may employ more complex strategies which may expose investors to additional risks.
Investing in fixed income securities involves certain risks such as market risk if sold prior to maturity and credit risk especially if investing in high yield bonds, which have lower ratings and are subject to greater volatility. All fixed income investments may be worth less than the original cost upon redemption or maturity. Bond Prices fluctuate inversely to changes in interest rates. Therefore, a general rise in interest rates can result in the decline of the value of your investment.
Definitions
MSCI- EAFE: The Morgan Stanley Capital International Europe, Australasia and Far East Index, a free float-adjusted market capitalization index that is designed to measure developed-market equity performance, excluding the United States and Canada.
MSCI-Emerging Markets: The Morgan Stanley Capital International Emerging Market Index, is a free float-adjusted market capitalization index that is designed to measure the performance of global emerging markets of about 25 emerging economies.
Russell 3000: The Russell 3000 measures the performance of the 3000 largest US companies based on total market capitalization and represents about 98% of the investible US Equity market.
ML BOFA US Corp Mstr [Merill Lynch US Corporate Master]: The Merrill Lynch Corporate Master Market Index is a statistical composite tracking the performance of the entire US corporate bond market over time.
ML Muni Master [Merill Lynch US Corporate Master]: The Merrill Lynch Municipal Bond Master Index is a broad measure of the municipal fixed income market.
Investors cannot directly purchase any index.
LIBOR, London Interbank Offered Rate, is the rate of interest at which banks offer to lend money to one another in the wholesale money markets in London.
The Dow Jones Industrial Average is an unweighted index of 30 “blue-chip” industrial U.S. stocks.
The S&P Midcap 400 Index is a capitalization-weighted index measuring the performance of the mid-range sector of the U.S. stock market, and represents approximately 7% of the total market value of U.S. equities. Companies in the Index fall between S&P 500 Index and the S&P SmallCap 600 Index in size: between $1-4 billion.
DJ Equity REIT Index represents all publicly traded real estate investment trusts in the Dow Jones U.S. stock universe classified as Equity REITs according to the S&P Dow Jones Indices REIT Industry Classification Hierarchy. These companies are REITs that primarily own and operate income-producing real estate.


