Last Week’s Markets in Review: Jobs, Inflation and Potential Sector Changes

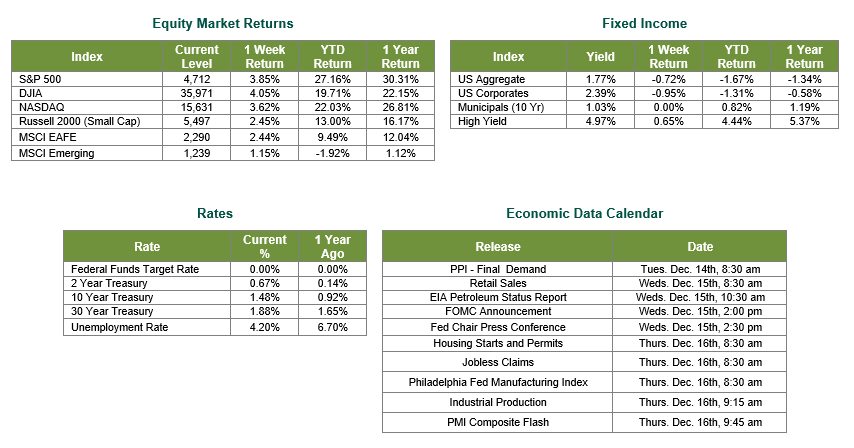
Global equity markets finished higher for the week. In the U.S., the S&P 500 Index closed the week at a level of 4,712, representing a gain of 3.85%, while the Russell Midcap Index moved 2.86% higher last week. Meanwhile, the Russell 2000 Index, a measure of the Nation’s smallest publicly traded firms, returned 2.45% over the week. International equity performance was also higher as developed, and emerging markets returned 2.44% and 1.15%, respectively. Finally, the 10-year U.S. Treasury yield moved higher, closing the week at 1.48%.
On Wednesday, the Bureau of Labor Statistics released the October data JOLTs report. The most important takeaway from the report was the level of job quitters, which fell 4.7% to 4.16 million from the previously reported 4.36 million. Job opening accelerated at a rate of 4.1%, totaling 11.03 million jobs, just below its all-time high and exceeding the number of individuals currently looking for employment by 3.6 million. According to Bloomberg, in more recent data, the weekly jobless claims came in lower than expected (184,000 vs. 220,000 estimated) and below pre-pandemic levels of a 220,000-weekly average in 2019.
In addition to the JOLTs report, the highly anticipated CPI data was released last Friday. The report showed a rise in the Consumer Price Index (CPI) of 6.8% in November, a year-over-year measure. Even though the data represents the fastest annual increase in nearly three decades, it was essentially in line with consensus economist estimates. The JOLTs and CPI prints will be important data reports to digest ahead of this week’s final policy meeting for the Federal Reserve.
Without breaking many major headlines, on November 29th, index providers MSCI and S&P announced potential changes to the Global Industry Classification Standard (GICS) structure for 2022. In their release, the providers have suggested reclassifications across all 11 sectors, inevitably affecting 69 different industries and 158 sub-industries. The most affected sectors from this proposal will come from the financials and technology areas of the market as companies Mastercard (Ticker: MA), Paypal (Ticker: PYPL), and Visa (Ticker: V). These companies would shift out of their current technology categorization into a “Transaction and Payments” sub-industry of Financials.
While the move does not directly affect the businesses of the above-stated companies, the reclassification may have a market impact. Consider this, at the time of this market update, MA, PYPL, and V are trading at an aggregate market capitalization of approximately $1 trillion. Shifting these companies away from the technology sector would increase the financial sector’s weighting within the S&P 500 Index from 11% to 13%. Not only could the move affect both S&P and MSCI broad index-based funds, but more importantly, it could have a significant impact on sector tracking funds.
However, it is important to note that reclassifications of the GICS structure are common. Our readers may remember as recently as 2018 when Facebook (now Meta), Netflix, and Google were moved from technology into the telecommunication services sector. This shift redefined telecom away from its “old-school” value characteristics and was reshaped to include the previously mentioned high-growth companies. We may expect the financial sector to undergo a similar dynamic shift with the proposed changes. In fact, over the past five years, the newly expected additions to the financials sector all outpaced the sector by more than double, as measured by the SPDR Select Financials ETF.

If these proposed adjustments do go into effect, the greatest impact could come from fund flows within sector indices. For example, the SPDR Select Technology ETF (Ticker: XLK), one of the largest technology ETFs by assets, currently holds 8.44% of its allocation to MA, V, and PYPL. Shifting these positions would create fund flows solely through SPDR funds of nearly $4.1 billion, a phenomenon that would have to occur across all ETF and mutual fund providers that manage similar sector index funds.
The cause and effect of potential sector adjustments are not fully known at this time. However, suppose these changes do go into effect. In that case, we believe it prudent to speak to financial professionals to determine the impact on your portfolio as shifts to style and sector weightings would occur across allocations. Ensuring portfolios are invested according to risk tolerance, objectives, and time horizon is of the utmost importance entering the final innings of 2021 as the days of heightened volatility are certainly not behind us.
We hope you are safely enjoying the holiday season and wish you the best in the week ahead!
JOLTS data was sourced from the Bureau of Labor Statistics on 12/8/2021. CPI data was sourced from the Department of Labor and Bloomberg on 12/10/2021. Chart and ETF data sourced from Kwanti Analytics using Morningstar data acquired on 12/9/21. Equity Market and Fixed Income returns are from JP Morgan as of 12/13/21. Rates and Economic Calendar Data from Bloomberg as of 12/13/21. International developed markets measured by the MSCI EAFE Index, emerging markets measured by the MSCI EM Index, U.S. Large Cap defined by the S&P 500. Sector performance is measured using the GICS methodology.
Disclosures: Past performance does not guarantee future results. We have taken this information from sources that we believe to be reliable and accurate. Hennion and Walsh cannot guarantee the accuracy of said information and cannot be held liable. You cannot invest directly in an index. Diversification can help mitigate the risk and volatility in your portfolio but does not ensure a profit or guarantee against a loss.
Diversification can help mitigate the risk and volatility in your portfolio but does not ensure a profit or guarantee against loss.
Investing in commodities is not suitable for all investors. Exposure to the commodities markets may subject an investment to greater share price volatility than an investment in traditional equity or debt securities. Investments in commodities may be affected by changes in overall market movements, commodity index volatility, changes in interest rates or factors affecting a particular industry or commodity.
Products that invest in commodities may employ more complex strategies which may expose investors to additional risks.
Investing in fixed income securities involves certain risks such as market risk if sold prior to maturity and credit risk especially if investing in high yield bonds, which have lower ratings and are subject to greater volatility. All fixed income investments may be worth less than the original cost upon redemption or maturity. Bond Prices fluctuate inversely to changes in interest rates. Therefore, a general rise in interest rates can result in the decline of the value of your investment.
Definitions
MSCI- EAFE: The Morgan Stanley Capital International Europe, Australasia and Far East Index, a free float-adjusted market capitalization index that is designed to measure developed-market equity performance, excluding the United States and Canada.
MSCI-Emerging Markets: The Morgan Stanley Capital International Emerging Market Index, is a free float-adjusted market capitalization index that is designed to measure the performance of global emerging markets of about 25 emerging economies.
Russell 3000: The Russell 3000 measures the performance of the 3000 largest US companies based on total market capitalization and represents about 98% of the investible US Equity market.
ML BOFA US Corp Mstr [Merill Lynch US Corporate Master]: The Merrill Lynch Corporate Master Market Index is a statistical composite tracking the performance of the entire US corporate bond market over time.
ML Muni Master [Merill Lynch US Corporate Master]: The Merrill Lynch Municipal Bond Master Index is a broad measure of the municipal fixed income market.
Investors cannot directly purchase any index.
LIBOR, London Interbank Offered Rate, is the rate of interest at which banks offer to lend money to one another in the wholesale money markets in London.
The Dow Jones Industrial Average is an unweighted index of 30 “blue-chip” industrial U.S. stocks.
The S&P Midcap 400 Index is a capitalization-weighted index measuring the performance of the mid-range sector of the U.S. stock market, and represents approximately 7% of the total market value of U.S. equities. Companies in the Index fall between S&P 500 Index and the S&P SmallCap 600 Index in size: between $1-4 billion.
DJ Equity REIT Index represents all publicly traded real estate investment trusts in the Dow Jones U.S. stock universe classified as Equity REITs according to the S&P Dow Jones Indices REIT Industry Classification Hierarchy. These companies are REITs that primarily own and operate income-producing real estate.


