Last Week’s Markets in Review: March Madness

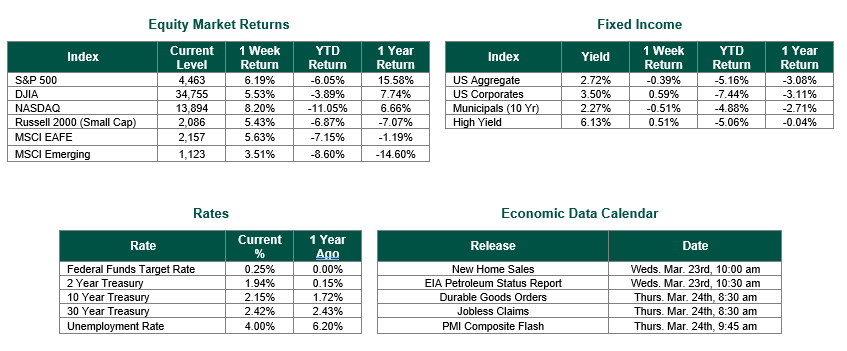
Global equity markets finished higher for the week. In the U.S., the S&P 500 Index closed the week at a level of 4,463, representing a gain of 6.19%, while the Russell Midcap Index moved 6.18% last week. Meanwhile, the Russell 2000 Index, a measure of the Nation’s smallest publicly traded firms, returned -5.43% over the week. International equity performance was higher as developed and emerging markets returned 5.63% and 3.51%, respectively. Finally, the 10-year U.S. Treasury yield moved higher, closing the week at 2.15%.
Sorry sports fans, but this market update is not regarding the likes of Gonzaga, UNC, or Duke. Instead, we will be discussing last week’s tip-off made by the Federal Reserve to raise interest rates by 0.25%, how markets reacted to the move and what investors might expect to happen in the months ahead.
On Wednesday, as widely anticipated, the Federal Open Market Committee (FOMC) decided to raise the Federal Funds target rate by 25 basis points. As we have written in recent market updates, this rate hike was in line with our expectations. However, markets were unsure if the Fed would be more aggressive with their first rate hike in years given the inflationary environment or would the current geopolitical events in Ukraine make for a more cautious decision. The latter would be the case, and markets reacted positively as the S&P 500 index closed the day up 2.34%, the second-highest single-day return for the index thus far in 2022.
Just as important as the rate hike announcement were the forecasts provided by the committee on future rate hikes, gross domestic product (GDP) growth, and inflation. The Fed’s updated “Dot Plot” chart, which highlights each Fed officials projection for the key short-term rate, shows a median projected target rate of 1.9% by the end of 2022. By comparison, the December chart showed a median projection of just 0.9%. This median target would suggest six more potential rate hikes of 25 basis points each in 2022, rather than the 3-4 hikes suggested from the December plot. As it stands now, the Fed is projecting the target rate to be 2.8% in 2023 and 2024, which would be above the neutral target rate of 2.375%.
Another point of interest for investors was the commentary on the Fed’s evolving position regarding quantitative tightening through balance sheet reductions. Indications pointed towards the likely start of balance sheet shrinkage as early as May, which would be earlier action than previously expected. Balance sheet reduction would likely involve the likely selling of billions of dollars worth of treasuries and mortgage-backed securities (along with not reinvesting the proceeds of maturing securities) and have a greater impact on the longer end of the yield curve to the actions of raising short term interest rates.
GDP growth forecasts were lowered to 2.8% for 2022 from the previous forecast of 4%. According to the Fed, the reduction is due to continued supply chain restraints, spillovers from the Russian invasion of Ukraine, and lagging monetary policy effects. While the revised forecast is lower than previously expected, it is important to note that historically, 2.8% is still considered strong for GDP growth. Lastly, the committee raised the forecast for inflation to 4.3% from 2.6%, as measured by the PCE deflator. For those not aware, the PCE Deflator is based on changes in personal consumption and is the preferred inflation measurement gauge of the FOMC.
The Fed announcement certainly gave a new meaning to “March Madness.” Our markets have now officially entered a rising interest rate environment while being paired with high inflation. We expect this period to be a slowing but still growing environment. As such, we continue to advise individuals to work with investment professionals to ensure their portfolios are invested in accordance with their objectives and risk tolerances.
Best wishes on your NCAA Brackets – and the week ahead!
Equity Market and Fixed Income returns are from JP Morgan as of 3/18/22. Rates and Economic Calendar Data from Bloomberg as of 3/18/22. International developed markets measured by the MSCI EAFE Index, emerging markets measured by the MSCI EM Index, U.S. Large Cap defined by the S&P 500. Sector performance is measured using the GICS methodology.
Disclosures: Past performance does not guarantee future results. We have taken this information from sources that we believe to be reliable and accurate. Hennion and Walsh cannot guarantee the accuracy of said information and cannot be held liable. You cannot invest directly in an index. Diversification can help mitigate the risk and volatility in your portfolio but does not ensure a profit or guarantee against a loss.
Diversification can help mitigate the risk and volatility in your portfolio but does not ensure a profit or guarantee against loss.
Investing in commodities is not suitable for all investors. Exposure to the commodities markets may subject an investment to greater share price volatility than an investment in traditional equity or debt securities. Investments in commodities may be affected by changes in overall market movements, commodity index volatility, changes in interest rates or factors affecting a particular industry or commodity.
Products that invest in commodities may employ more complex strategies which may expose investors to additional risks.
Investing in fixed income securities involves certain risks such as market risk if sold prior to maturity and credit risk, especially if investing in high yield bonds, which have lower ratings and are subject to greater volatility. All fixed income investments may be worth less than the original cost upon redemption or maturity. Bond Prices fluctuate inversely to changes in interest rates. Therefore, a general rise in interest rates can result in the decline of the value of your investment.
Definitions
MSCI- EAFE: The Morgan Stanley Capital International Europe, Australasia and Far East Index, a free float-adjusted market capitalization index that is designed to measure developed-market equity performance, excluding the United States and Canada.
MSCI-Emerging Markets: The Morgan Stanley Capital International Emerging Market Index, is a free float-adjusted market capitalization index that is designed to measure the performance of global emerging markets of about 25 emerging economies.
Russell 3000: The Russell 3000 measures the performance of the 3000 largest US companies based on total market capitalization and represents about 98% of the investible US Equity market.
ML BOFA US Corp Mstr [Merill Lynch US Corporate Master]: The Merrill Lynch Corporate Master Market Index is a statistical composite tracking the performance of the entire US corporate bond market over time.
ML Muni Master [Merill Lynch US Corporate Master]: The Merrill Lynch Municipal Bond Master Index is a broad measure of the municipal fixed income market.
Investors cannot directly purchase any index.
LIBOR, London Interbank Offered Rate, is the rate of interest at which banks offer to lend money to one another in the wholesale money markets in London.
The Dow Jones Industrial Average is an unweighted index of 30 “blue-chip” industrial U.S. stocks.
The S&P Midcap 400 Index is a capitalization-weighted index measuring the performance of the mid-range sector of the U.S. stock market, and represents approximately 7% of the total market value of U.S. equities. Companies in the Index fall between S&P 500 Index and the S&P SmallCap 600 Index in size: between $1-4 billion.
DJ Equity REIT Index represents all publicly traded real estate investment trusts in the Dow Jones U.S. stock universe classified as Equity REITs according to the S&P Dow Jones Indices REIT Industry Classification Hierarchy. These companies are REITs that primarily own and operate income-producing real estate.


