Last Week’s Markets in Review: Political Drama and Economic Data Move Markets

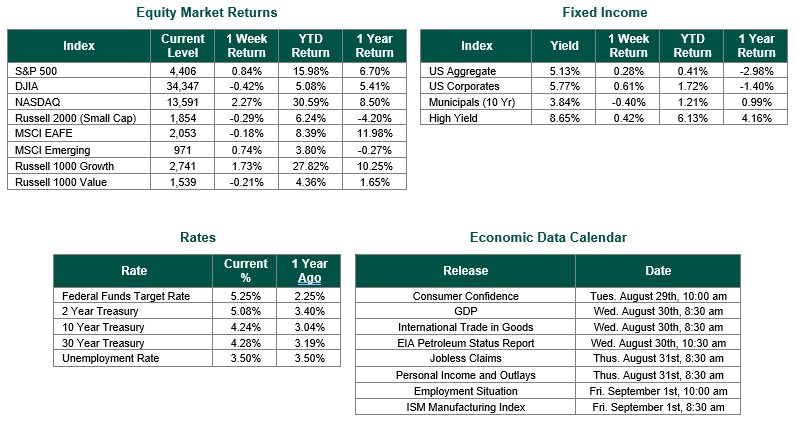
Global equity markets finished mixed for the week. In the U.S., the S&P 500 Index closed the week at a level of 4,288, representing a decrease of -0.71%, while the Russell Midcap Index moved 0.28% last week. Meanwhile, the Russell 2000 Index, a measure of the Nation’s smallest publicly traded firms, returned 0.55% over the week. As developed international equity performance and emerging markets were lower, returning -1.42% and -1.16%, respectively. Finally, the 10-year U.S. Treasury yield moved higher, closing the week at 4.57%.
The third quarter’s last week was full of economic data and political drama. On Tuesday, the markets digested housing information and a Consumer Confidence reading. In the middle of the week, the Durable Goods Orders report for September was released. In addition, Thursday and Friday saw the results for second-quarter gross domestic product (GDP), weekly Jobless Claims, and Personal Income and Outlays for September released. Finally, Washington D.C. battled throughout the week to keep the Government open. While all Politicians were actively trying to keep the Government running, the House of Representatives and Speaker McCarthy were center stage in the funding drama.
U.S. consumer confidence not surprisingly dropped to a 4-month low in September, weighed down by persistent worries about higher prices and rising fears of a potential recession. The second straight monthly decline in confidence reported by the Conference Board also reflected higher interest rates and concerns about the political environment. The index reported a result of 103.0, below the prior month’s reading of 106.1 and the consensus estimate of 105.8. New Home sales for August fell short of the preceding month and the consensus estimate.
The third estimate of second-quarter GDP was unrevised at 2.1%. The U.S. economy maintained a fairly solid pace of growth, and activity appears to have accelerated this quarter. Still, the ongoing strike by auto workers is dimming the outlook for the rest of 2023. It should be noted that the Federal Reserve, according to their most recent Summary of Economic Projections, forecasts that GDP growth will close out 2023 at 2.1% before slowing to 1.5% in 2024 and then staying below 2% in 2025 and 2026.
The weekly Jobless Claims report from the Labor Department showed initial claims rose 2,000 to 204,000, below the forecasted level of 215,000. Claims have stayed at the lower end of their 194,000 to 265,000 range thus far in 2023. The number of people receiving benefits after an initial week of aid, a proxy for hiring, increased by 12,000 to a still-low level of 1.67 million.
An economic indicator the Federal Reserve favors as an inflation gauge rose less than expected in August, showing that the central bank’s fight against inflation is making progress. The August Personal Consumption Expenditures (PCE) Price Index, excluding food and energy, increased 0.1%, lower than the expected reading of 0.2%. On a 12-month basis, the annual increase for core PCE was 3.9%. The August monthly result was the lowest increase since November 2020, though still about the Fed’s inflation target of 2%. Along with the modest inflation gain, consumer spending rose 0.4% but decreased sharply from the 0.9% spending gain reported in July.
As it relates to the Capitol Hill drama concerning funding the Government., many observers believed that a shutdown of the Federal Government was unavoidable. However, with time running out on Saturday, the House, Senate, and President Biden signed a 45-day Continuing Resolution (CR) to avoid a government shutdown…for now.
Best wishes for the week ahead.
Consumer Confidence data is sourced from The Conference Board. GDP and PCE data are sourced from the U.S. Bureau of Economic Analysis. Weekly Jobless Claims are sourced from the Labor Department. Equity Market, Fixed Income returns, and rates are from Bloomberg as of 9/29/23. Economic Calendar Data from Econoday as of 9/29/23. International developed markets are measured by the MSCI EAFE Index, emerging markets are measured by the MSCI EM Index, and U.S. Large Caps are defined by the S&P 500 Index. Sector performance is measured using the GICS methodology.
Disclosures: Past performance does not guarantee future results. We have taken this information from sources that we believe to be reliable and accurate. Hennion and Walsh cannot guarantee the accuracy of said information and cannot be held liable. You cannot invest directly in an index. Diversification can help mitigate the risk and volatility in your portfolio but does not ensure a profit or guarantee against a loss.


