Last Week’s Markets in Review: Powell Suggests Smaller Rate Hikes Ahead

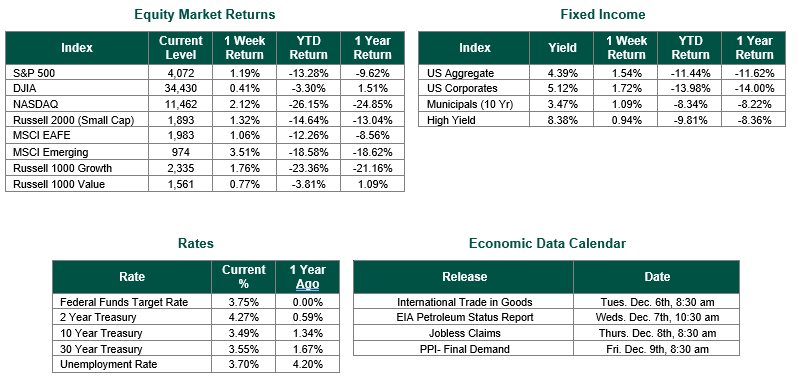
Global equity markets finished higher for the week. In the U.S., the S&P 500 Index closed the week at a level of 4,072 representing an increase of 1.19%, while the Russell Midcap Index moved 1.94% higher last week. Meanwhile, the Russell 2000 Index, a measure of the Nation’s smallest publicly traded firms, returned 1.32% over the week. As developed, international equity performance and emerging markets were higher returning 1.06% and 3.51%, respectively. Finally, the 10-year U.S. Treasury yield moved lower, closing the week at 3.49%.
The past week saw the release of new data concerning the economy, inflation, and employment. Even with a full calendar of meaningful economic data, the headline event was Federal Reserve Chairman Jerome Powell’s speech last Wednesday. Throughout this update, we will analyze Powell’s speech and the markets’ reaction to the Chairman’s comments. We will also cover the economic data’s highlights and explain how it is interrelated.
On Wednesday morning, the Bureau of Labor Statistics (BLS) released the October Job Openings and Labor Turnover Survey (JOLTS). The report showed 10.33 million job vacancies, a decline of 353,000 openings from September. Many market participants viewed this decline in available jobs as an indication that the Fed’s rate hikes were slowing overall employment, a necessary step in the Fed’s plan to lower inflation.
Also, the Bureau of Economic Analysis (BEA) released the second estimate for third-quarter gross domestic product (GDP) on Wednesday morning. The report showed that the U.S. economy grew at an annualized rate of 2.9%. The rate of growth was above the consensus estimate of 2.7%.
Finally, on Wednesday, Chairman Powell provided commentary at the Brookings Institute. Powell maintained that monetary policy will likely stay restrictive for some time until real signs of progress emerge on bringing down inflation and stated, “We will stay the course until the job is done.” However, the headline that ignited a meaningful rally in equities was Fed Chair Powell saying that smaller interest rate hikes could start in December. Such a move would signal to the market that peak hawkishness and, by extension, peak inflation have likely been reached. Why is this important? According to BlackRock, the stocks in the S&P 500 index have increased by 11.5%, on average, in the year following peak inflation between 1927-2022. Of course, past performance is not indicative of future results.
On Thursday, October’s core personal consumption expenditures price index (PCE) rose 0.2%. This reading was slightly below the consensus estimate of 0.3%. The Federal Reserve favors this index as an indicator of inflation.
All of this good news concerning future monetary policy that may be less restrictive was interrupted by a red-hot employment report for November, which was released on Friday morning. The Labor Department reported that nonfarm payrolls increased by 263,000 during November. This total was substantially higher than the consensus estimate of 200,000. Average hourly earnings jumped by 0.6% for the month and were double the consensus estimate.
According to the CME Fed Watch Tool, there is now a 74.7% chance of a 50 Basis Point (0.50%) rate hike following the December FOMC meeting. We count ourselves in this strong majority and expect a 50 Basis Point hike. We also believe that the Fed has moved past its “Peak Hawkishness” position and may continue to decrease the size of future rate hikes at the beginning of 2023.
Investors should consider all the information discussed within this market update and many other factors when managing their investment portfolios. However, with so much data and so little time to digest, we encourage investors to work with experienced financial professionals to help process all this information to build and manage the asset allocations within their portfolios consistent with their objectives, timeframe, and tolerance for risk.
Best wishes for the week ahead!
The JOLTS report is sourced from the Bureau of Labor Statistics. GDP data is sourced from the Bureau of Economic Analysis. The core Personal Consumption Expenditures price index is sourced from the Commerce Department. Monthly employment data is sourced from the Department of Labor. Equity Market and Fixed Income returns are from JP Morgan as of 12/2/22. Rates and Economic Calendar Data from Bloomberg as of 12/2/22. International developed markets are measured by the MSCI EAFE Index, emerging markets are measured by the MSCI EM Index, and U.S. Large Caps are defined by the S&P 500 Index. Sector performance is measured using the GICS methodology.
Disclosures: Past performance does not guarantee future results. We have taken this information from sources that we believe to be reliable and accurate. Hennion and Walsh cannot guarantee the accuracy of said information and cannot be held liable. You cannot invest directly in an index. Diversification can help mitigate the risk and volatility in your portfolio but does not ensure a profit or guarantee against a loss.


