Last Week’s Markets in Review: Prevalent Recession Concerns Ahead of Rate Hikes
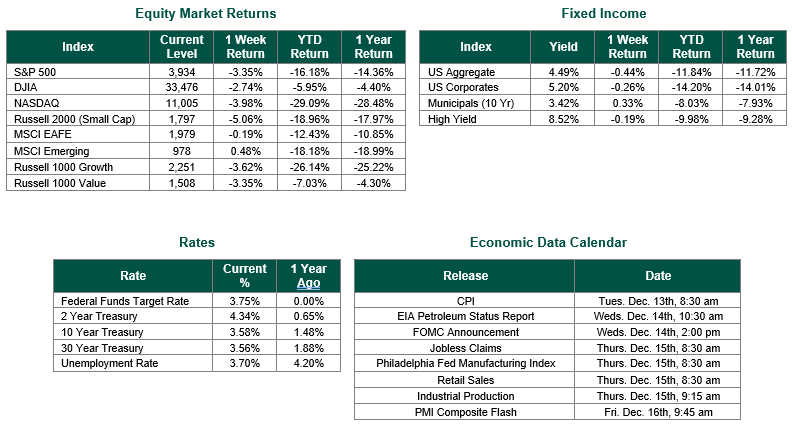
Global equity markets finished lower for the week. In the U.S., the S&P 500 Index closed the week at a level of 3,934, representing a loss of 3.35%, while the Russell Midcap Index moved 3.34% lower last week. Meanwhile, the Russell 2000 Index, a measure of the Nation’s smallest publicly traded firms, returned -5.06% over the week. As developed, international equity performance and emerging markets were mixed, returning -0.19% and 0.48%, respectively. Finally, the 10-year U.S. Treasury yield moved higher, closing the week at 3.58%.
A quiet week of economic data did not translate equally to markets. The S&P 500 VIX, a measure of the 30-day implied volatility of the S&P 500 Index, increased 19.77% last week as market participants continued their gut-wrenching task of predicting Fed rate hikes and future probabilities of a recession. As exhaustive as these two themes have been throughout 2022, they are impossible to ignore. Jobless claims continue to remain low relative to a typical recessionary environment, trade balance deficits have increased (albeit at a lower than consensus rate), and inflation signals through producer prices showed continued inflationary pressures. The trifecta of Federal Reserve signals over the past week would all point to concerns over the aggressiveness of Jerome Powell and the Fed in managing the U.S. economy while trying to bring inflation back in balance.
Surprisingly, the probability of a 50-basis point rate hike this coming Wednesday only dropped slightly, according to CME Group, with the likelihood moving to 74.7% from 78.2% the week prior. With near-term rate hikes remaining mostly unchanged, the market’s reaction has been more focused on the duration of rate hikes and whether the U.S. economy can withstand rate levels projected by the Fed without creating a more severe recession than would have occurred if not for these aggressive rate hikes. If we look at the bond market for answers, the writing is on the wall. As it stands now, the treasury market has experienced 109 days of 2- to 10-year yield curve inversion, ranking in the 80th percentile of inversion durations dating back to 1990. The only instances that rank longer during this period were in 2000 (229 days), ahead of the tech bubble crash, and in 2006/2007 (196 days), ahead of the global financial crisis.
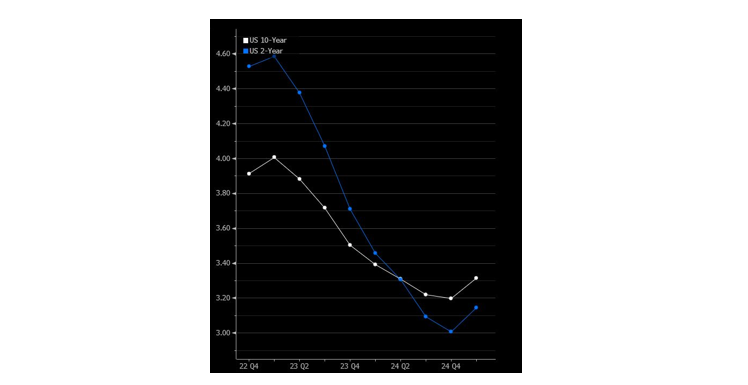
What is more alarming is that the current state of yield curve inversion duration could easily surpass the periods mentioned above. Based on current forward-looking yield curves (as seen below), inversion is projected to last not only throughout 2023 but into the second quarter of 2024. If the forward markets are correct, this would handily represent the longest stretch of curve inversion in the past 3+ decades.
The near-term concerns of the U.S. economy compared to the longer-term view are presented in the risk premium required by investors through the yields of U.S. Treasuries. While the yield curve is not a guaranteed predictor of future expectations, it should be considered when making investment decisions.
Investors should consider all the information discussed within this market update and many other factors when managing their investment portfolios. However, with so much data and so little time to digest, we encourage investors to work with experienced financial professionals to help process all this information to build and manage the asset allocations within their portfolios consistent with their objectives, timeframe, and tolerance for risk.
Best wishes for the week ahead!
S&P Implied Volatility data from Bloomberg on 12/9/2022. Treasury yield data sourced from The U.S. Department of Treasury on 12/9/2022. Forward yield curve data and chart sourced from Bloomberg on 12/9/2022. Equity Market and Fixed Income returns are from JP Morgan as of 12/9/22. Rates and Economic Calendar Data from Bloomberg as of 12/9/22. International developed markets are measured by the MSCI EAFE Index, emerging markets are measured by the MSCI EM Index, and U.S. Large Caps are defined by the S&P 500 Index. Sector performance is measured using the GICS methodology.
Disclosures: Past performance does not guarantee future results. We have taken this information from sources that we believe to be reliable and accurate. Hennion and Walsh cannot guarantee the accuracy of said information and cannot be held liable. You cannot invest directly in an index. Diversification can help mitigate the risk and volatility in your portfolio but does not ensure a profit or guarantee against a loss.