Last Week’s Markets in Review: Putting Volatility and Inflation into Perspective

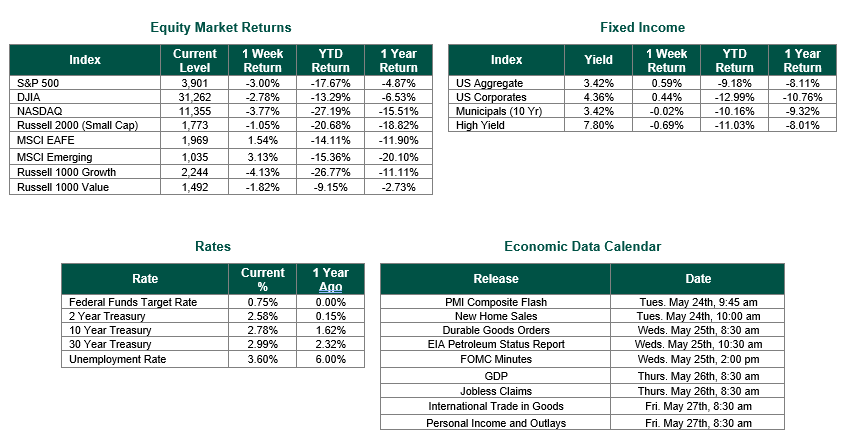
Global equity markets finished lower for the week. In the U.S., the S&P 500 Index closed the week at a level of 3,901, representing a decline of 3.00%, while the Russell Midcap Index moved 1.95% lower last week. Meanwhile, the Russell 2000 Index, a measure of the Nation’s smallest publicly traded firms, returned -1.05% over the week. As developed, international equity performance was higher, and emerging markets returned 1.54% and 3.13%, respectively. Finally, the 10-year U.S. Treasury yield moved lower, closing the week at 2.78%.
While the S&P 500 Index (S&P 500) and Dow Jones Industrial Average (DJIA) both essentially finished flat on Friday, they ended the week lower overall. According to Dow Jones Market Data, this result marked the seventh consecutive week of declines for the S&P 500 and the 8th consecutive week of declines for the DJIA – which is the first 8-week losing streak for the DJIA since April 1932. Much of the downturn in stock prices can be attributed to the more hawkish pivot of the Federal Reserve earlier this year to help combat persistent record inflation levels.
Not surprisingly, individual investors have become fearful of:
o Recent Market Volatility
o Inflation
o Rising Interest Rates
o An Economic Slowdown
o All of the Above
All of these fears may lead investors to make knee-jerk reactions to sell and then try to get back in the market when the “coast is clear.” Unfortunately, no “coast is all clear” signal is ever provided to investors, and no crystal ball exists that will accurately predict when the bottom of a market correction will occur. Staying invested, incorporating diversification into your portfolios, and focusing on the long term is often a more prudent path to follow. In our view, trying to time the market is often an exercise in futility, remembering that timing the market requires being correct twice: when to get out AND when to get back in. If the timing is off, as is often the case, longer-term portfolio performance can be significantly impacted.
We did learn a little bit more about the strength and confidence of the consumer this week and the impact that record-setting levels of inflation are having on certain retailers. Earnings from Walmart and Target disappointed as inflation reared its ugly head. In the case of Target, revenue rose 4% over the past quarter to $25.17 billion, and same-store sales climbed 3.3%. However, earnings fell to $2.19 a share vs. analyst expectations for $3.07 a share. Target suggested that higher freight costs and weaker-than-anticipated sales of most costly discretionary items were primary factors for the earnings miss. In the case of Walmart, both revenue and same-store sales exceeded expectations for the most recent quarter. However, as was the case with Target, earnings came in at $1.30 a share, below analyst estimates looking for $1.48 per share. Walmart indicated that inflation levels, particularly in the areas of food and fuel, created more pressure on profit margins and operating costs than they expected.
Both of these earnings releases led to more market volatility as they provided investors with a glimpse into what may lie ahead for retail sales. It is important to remember that consumer spending accounts for approximately 70% of gross domestic product (GDP) in the U.S. If the consumer begins to spend less, the economy will slow down further. Additionally, suppose retailers choose to pass on their own inflated costs (as recognized by comments by Walmart and Target) to consumers. In that case, these consumers may balk at the prospect of paying the higher prices, thus leading to a potential reduction in revenues for these companies during future quarters.
As it relates to retail sales, this past Tuesday, the Commerce Department reported total U.S. Retail and Food Services Sales for April 2022. April sales were $677.7 billion, an increase of 0.9% from the prior month and 8.2% above April 2021. Both increases were in line with consensus estimates. Additionally, the Commerce Department revised higher the spending totals for March. The revision moved March’s spending from a rise of 0.5% to a 1.4% gain. These data points may suggest that the consumer has not been overly affected by record-high inflation and market volatility…thus far.
Given all of the persistent market volatility and economic uncertainty, now may be the optimal time to review your portfolio with a financial professional to help ensure that your investments are sufficiently diversified and allocated towards the appropriate asset classes associated with your specific financial objectives, risk tolerance, investment horizon, and liquidity needs.
Best wishes for the week ahead!
Equity Market and Fixed Income returns are from JP Morgan as of 5/20/22. Rates and Economic Calendar Data from Bloomberg as of 5/20/22. International developed markets are measured by the MSCI EAFE Index, emerging markets are measured by the MSCI EM Index, and U.S. Large Caps are defined by the S&P 500 Index. Sector performance is measured using the GICS methodology.
Disclosures: Past performance does not guarantee future results. We have taken this information from sources that we believe to be reliable and accurate. Hennion and Walsh cannot guarantee the accuracy of said information and cannot be held liable. You cannot invest directly in an index. Diversification can help mitigate the risk and volatility in your portfolio but does not ensure a profit or guarantee against a loss.
Diversification can help mitigate the risk and volatility in your portfolio but does not ensure a profit or guarantee against loss.
Investing in commodities is not suitable for all investors. Exposure to the commodities markets may subject an investment to greater share price volatility than an investment in traditional equity or debt securities. Investments in commodities may be affected by changes in overall market movements, commodity index volatility, changes in interest rates or factors affecting a particular industry or commodity.
Products that invest in commodities may employ more complex strategies which may expose investors to additional risks.
Investing in fixed income securities involves certain risks such as market risk if sold prior to maturity and credit risk, especially if investing in high yield bonds, which have lower ratings and are subject to greater volatility. All fixed income investments may be worth less than the original cost upon redemption or maturity. Bond Prices fluctuate inversely to changes in interest rates. Therefore, a general rise in interest rates can result in the decline of the value of your investment.
Definitions
MSCI- EAFE: The Morgan Stanley Capital International Europe, Australasia and Far East Index, a free float-adjusted market capitalization index that is designed to measure developed-market equity performance, excluding the United States and Canada.
MSCI-Emerging Markets: The Morgan Stanley Capital International Emerging Market Index, is a free float-adjusted market capitalization index that is designed to measure the performance of global emerging markets of about 25 emerging economies.
Russell 3000: The Russell 3000 measures the performance of the 3000 largest US companies based on total market capitalization and represents about 98% of the investible US Equity market.
ML BOFA US Corp Mstr [Merill Lynch US Corporate Master]: The Merrill Lynch Corporate Master Market Index is a statistical composite tracking the performance of the entire US corporate bond market over time.
ML Muni Master [Merill Lynch US Corporate Master]: The Merrill Lynch Municipal Bond Master Index is a broad measure of the municipal fixed income market.
Investors cannot directly purchase any index.
LIBOR, London Interbank Offered Rate, is the rate of interest at which banks offer to lend money to one another in the wholesale money markets in London.
The Dow Jones Industrial Average is an unweighted index of 30 “blue-chip” industrial U.S. stocks.
The S&P Midcap 400 Index is a capitalization-weighted index measuring the performance of the mid-range sector of the U.S. stock market and represents approximately 7% of the total market value of U.S. equities. Companies in the Index fall between S&P 500 Index and the S&P SmallCap 600 Index in size: between $1-4 billion.
DJ Equity REIT Index represents all publicly traded real estate investment trusts in the Dow Jones U.S. stock universe classified as Equity REITs according to the S&P Dow Jones Indices REIT Industry Classification Hierarchy. These companies are REITs that primarily own and operate income-producing real estate.


