Rate Cuts Paused and Tariffs Announced
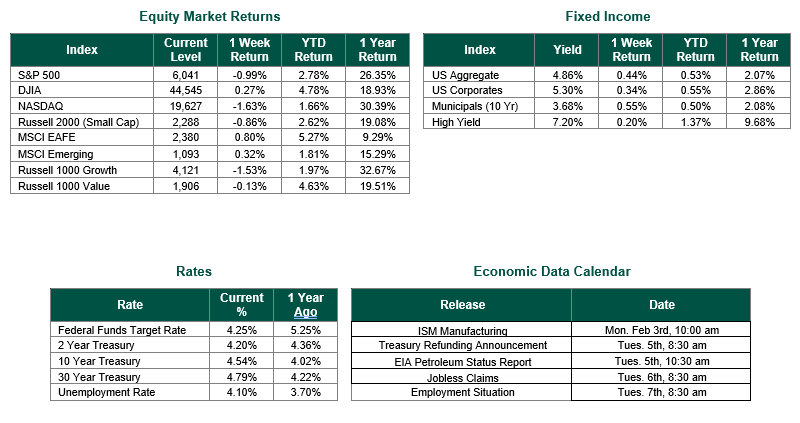
Global equity markets finished mixed for the week. In the U.S., the S&P 500 Index closed the week at a level of 6,041, representing a decline of -0.99%, while the Russell Midcap Index moved -0.02% last week. Meanwhile, the Russell 2000 Index, a measure of the Nation’s smallest publicly traded firms, returned -0.86% over the week. Developed international equity performance and emerging markets were positive, returning 0.80% and 0.32%, respectively. Finally, the 10-year U.S. Treasury yield moved higher, closing the week at 4.54%.
As widely expected, the Federal Reserve paused on Wednesday, leaving the Federal Funds Target Rate in its current range of 4.25%-4.50%. Accompanying this announcement, the Fed made the following statement, “Recent indicators suggest that economic activity has continued to expand at a solid pace. The unemployment rate has stabilized at a low level in recent months, and labor market conditions remain solid. Inflation remains somewhat elevated.”
We would interpret the statement above to indicate that no additional interest rate cuts (and certainly not increases) should be expected in the near future. The FOMC does not meet in February and will likely pause again following their meeting in the middle of March. This action and this announcement are consistent with our view that the Fed will adopt a more gradual pace of easing in 2025 and 2026 with no single rate cuts of greater than 25 Bp until the Fed Funds Target Rate is closer to their new long-run neutral rate expectation of 3% (which may not be achieved by the end of 2026), given the many lingering uncertainties surrounding the labor market, inflation, potential tariffs, and the policies to be implemented by the Trump administration.
Overall, according to the Fed’s forecasts above, rates, yields, and inflation should all be lower, and economic growth should be relatively stable over the next two + years. This longer-term outlook bodes well for both stocks and bonds, but the next two years will likely look very different than the last two years, and investors would be wise to plan and adjust their portfolios accordingly.
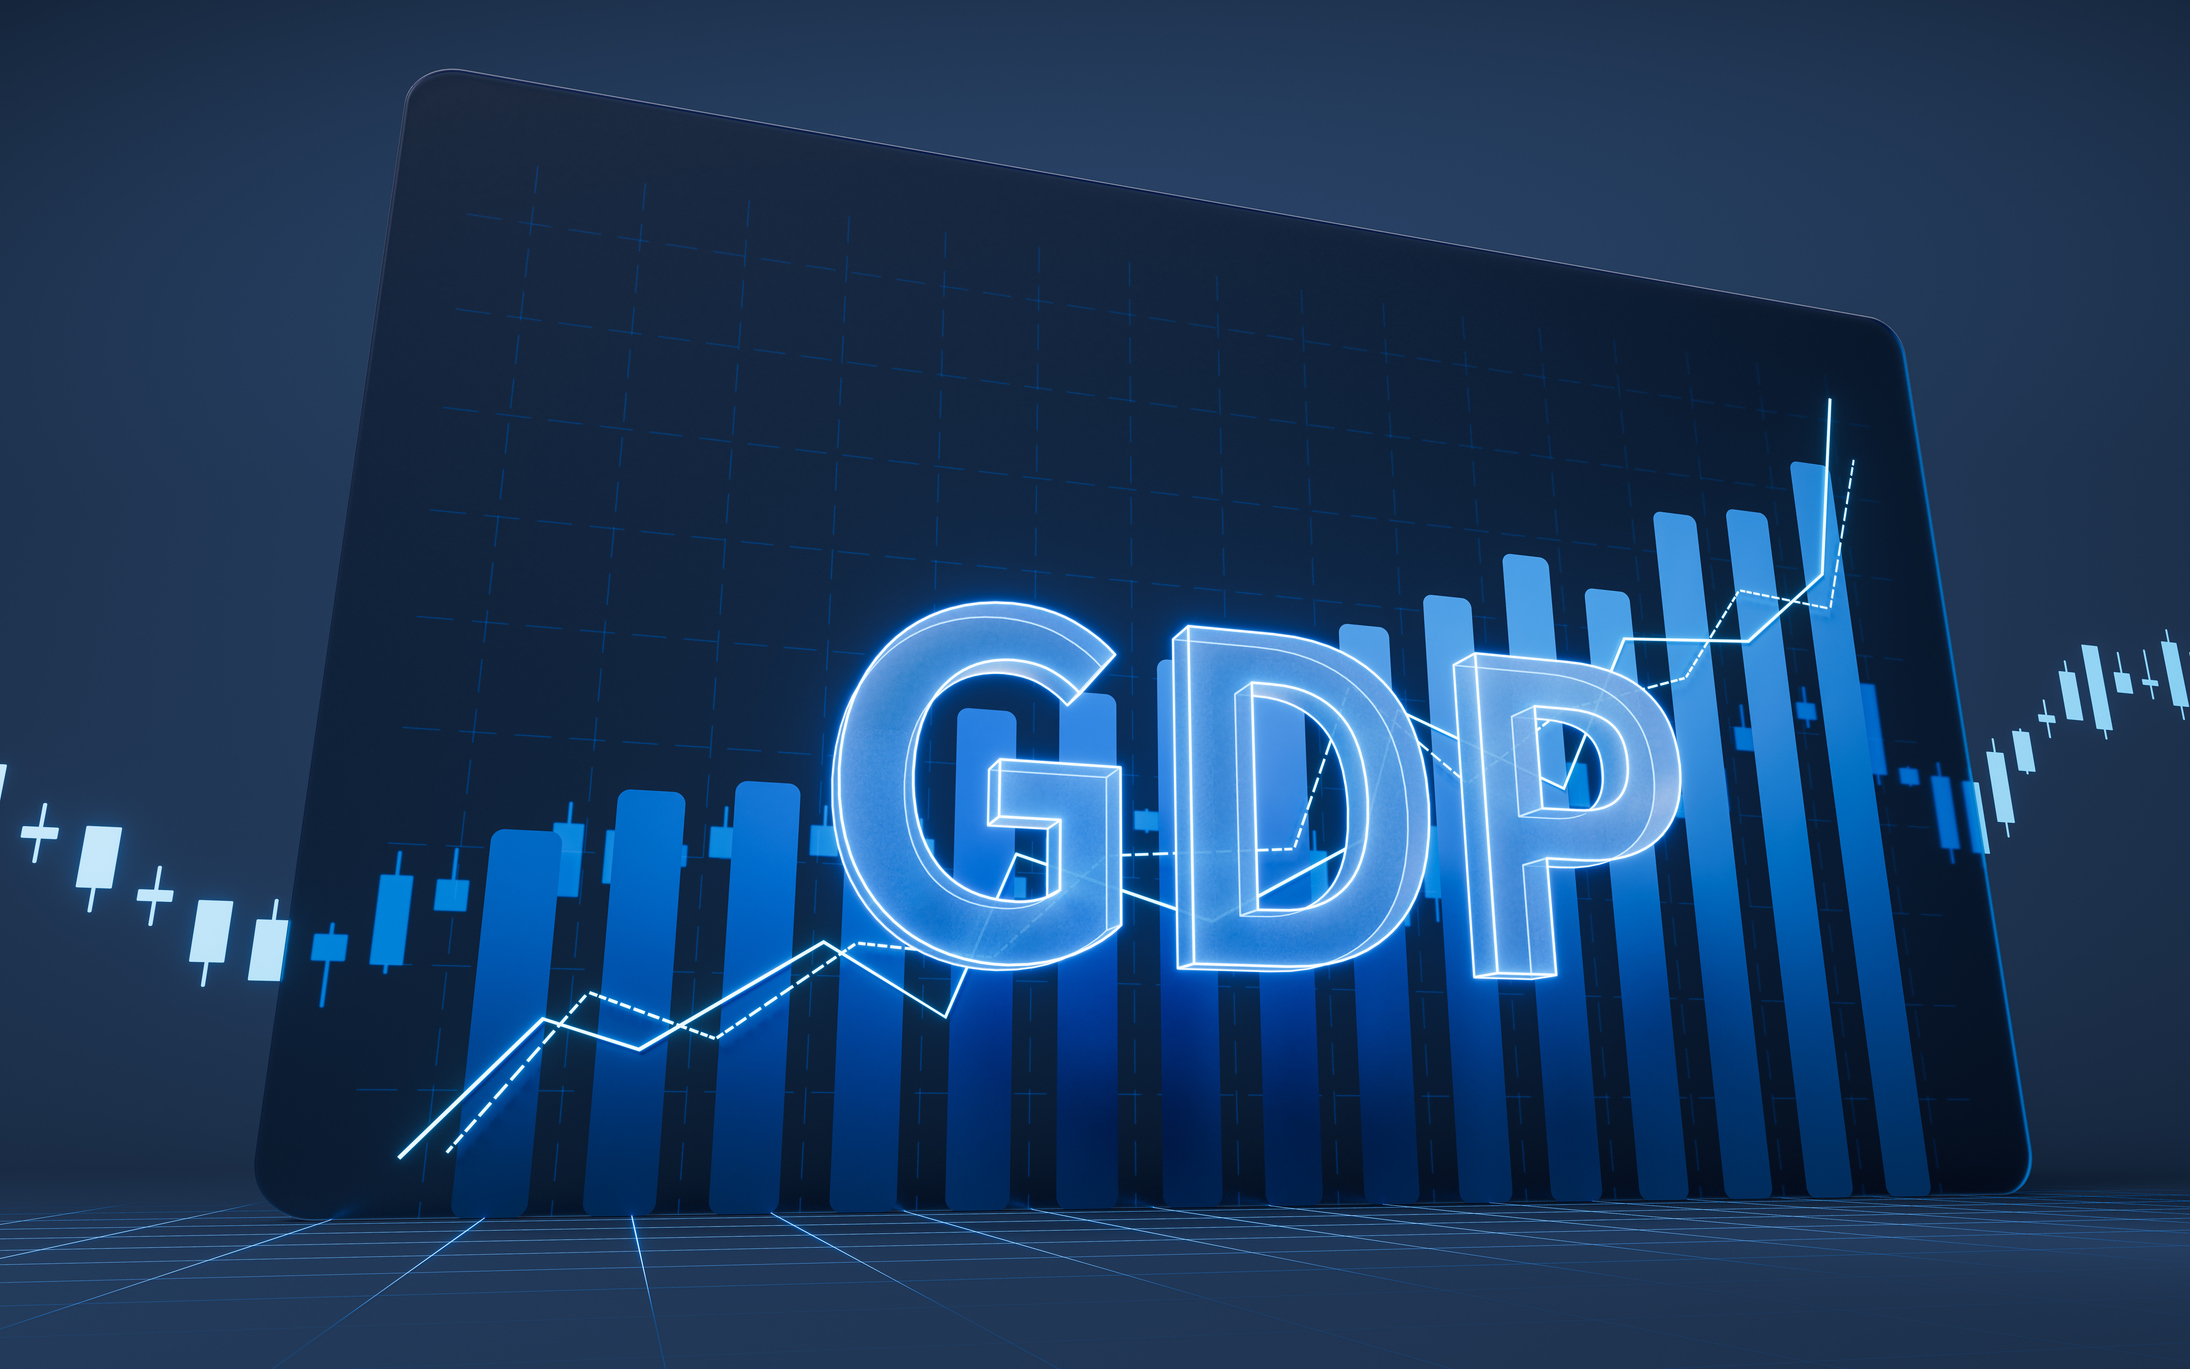
Following the FOMC meeting, the Commerce Department released the Gross Domestic Product for the 4th quarter of 2024 on Thursday. GDP, a measure of all the goods and services produced across the U.S. economy, showed that the economy accelerated at a 2.3% annualized inflation-adjusted pace in the fourth quarter. The consensus estimate had been expecting an increase of 2.5% after growth of 3.1% in the third quarter. For the full year, GDP accelerated 2.8%, compared with 2.9% in 2023.
Friday saw the release of the personal consumption expenditures (PCE) price index by the Commerce Department. The Index increased 2.6% on a year-over-year basis in December, 0.2 percentage points higher than the November reading and in line with the consensus estimate. Excluding food and energy, core PCE registered a 2.8% reading, meeting expectations the same as the prior month. Though the Fed considers both readings, historically, officials have seen core as the better gauge of long-run inflation.
Finally, late on Friday afternoon and throughout the weekend, the Trump Administration pushed the implementation of trade tariffs on Canada, Mexico, and China. The trade penalties that Trump signed Saturday caused a mix of panic, anger, and uncertainty. These emotions were exhibited with downward pressure on equity prices early Monday morning in general and, more specifically, on industries that produce much of their product in either Canada or Mexico. Tariffs are a fluid situation and are likely to continue to change rapidly over the upcoming weeks.
Best wishes for the week ahead!
Equity and Fixed Income Index returns sourced from Bloomberg on 1/31/25. FOMC data is sourced from the Federal Reserve Bank. GDP and PCE data are sourced from the Commerce Department. Retail Sales data is sourced from the Commerce Department’s Census Bureau. Economic Calendar Data from Econoday as of 1/31/25. International developed markets are measured by the MSCI EAFE Index, emerging markets are measured by the MSCI EM Index, and U.S. Large Caps are defined by the S&P 500 Index. Sector performance is measured using the GICS methodology.
Disclosures: Past performance does not guarantee future results. We have taken this information from sources that we believe to be reliable and accurate. Hennion and Walsh cannot guarantee the accuracy of said information and cannot be held liable. You cannot invest directly in an index. Diversification can help mitigate the risk and volatility in your portfolio but does not ensure a profit or guarantee against a loss.