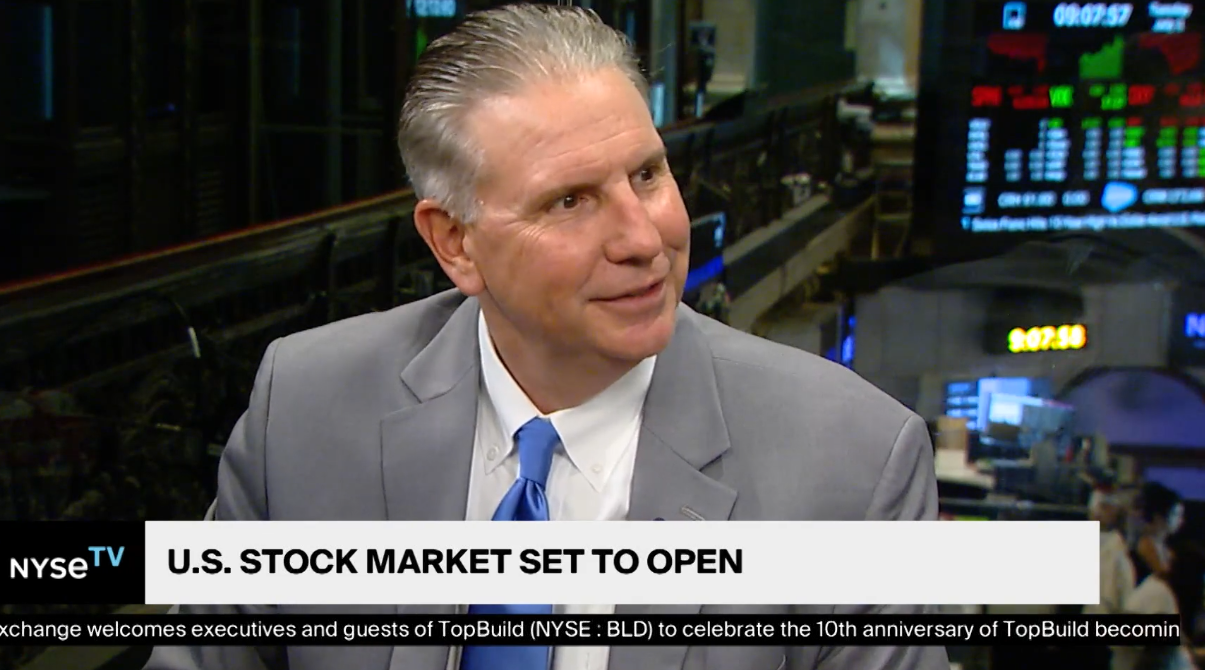
Softer Employment Data Upsets Markets

Global equity markets finished lower for the week. In the U.S., the S&P 500 Index closed the week at a level of 5347, representing a decrease of 2.05%, while the Russell Midcap Index moved -2.82% last week. Meanwhile, the Russell 2000 Index, a measure of the Nation’s smallest publicly traded firms, returned -6.66% over the week. As developed international equity performance and emerging markets were lower, returning -1.95% and -0.99%, respectively. Finally, the 10-year U.S. Treasury yield moved lower, closing the week at 3.79%.
The past week was dominated by employment data that caused a fair amount of turmoil within the financial markets, which has carried through into the early stages of this week. Prior to the release of the employment data, the Federal Open Market Committee (FOMC) announced the results of their July meeting. Both monetary policy and the current employment dynamic will be analyzed in this update.
The FOMC kept the federal funds rate unchanged at 5.25% – 5.50% for the eighth straight meeting. The language within the official statement was altered in a manner that would suggest rate cuts are quickly approaching. During his press conference, Chairman Powell suggested, “a reduction in our policy rate could be on the table as soon as the next meeting in September.” Markets moved slightly higher through the first three days of the week on the idea that the Fed will soon be reducing short-term interest rates.
Market sentiment, however, changed dramatically after the July Employment report was released at the end of the week. Nonfarm payrolls grew by just 114,000 for the month, down from the downwardly revised 179,000 in June and below the consensus estimate of 185,000. The unemployment rate also edged higher to 4.3%, its highest since October 2021. Up until this point, the labor market had been a pillar of economic strength, but this report caused great concern to investors with respect to the pace and magnitude of this economic slowdown potentially heading toward a recessionary period. This concern may be justified as, according to the Sahm Rule, which looks at changes in the unemployment rate, we may already be in a recession. The Sahm Rule indicates that the U.S. economy is in a downturn when the 3-month moving average of the unemployment rate rises by 0.5% from its 12-month low. The downturn indicator was just triggered last week with a reading of 0.53%. While this time may be different, the indicator does have a perfect track record of predicting recessions through at least the last nine recessions.
All of this could lead to the Federal Reserve having to play catch-up and potentially get back to their three planned cuts (potentially now even greater in the magnitude of the cuts) that were a part of their March 2024 Dot Plot chart.
During periods of unrest in the markets, we would like to remind our readers of the timeless advice that long-term market performance is often more related to “Time in the market and not about Timing the market” and building (and managing) portfolios consistent with your specific objectives, timeframe, and tolerance for risk.
Best wishes for the week ahead!
FOMC Data is sourced from The Federal Reserve. Employment data is sourced from The Department of Labor. Economic Calendar Data from Econoday as of 8/2/24. International developed markets are measured by the MSCI EAFE Index, emerging markets are measured by the MSCI EM Index, and U.S. Large Caps are defined by the S&P 500 Index. Sector performance is measured using the GICS methodology.
Disclosures: Past performance does not guarantee future results. We have taken this information from sources that we believe to be reliable and accurate. Hennion and Walsh cannot guarantee the accuracy of said information and cannot be held liable. You cannot invest directly in an index. Diversification can help mitigate the risk and volatility in your portfolio but does not ensure a profit or guarantee against a loss.


