Summer Ends with Positive Economic Data

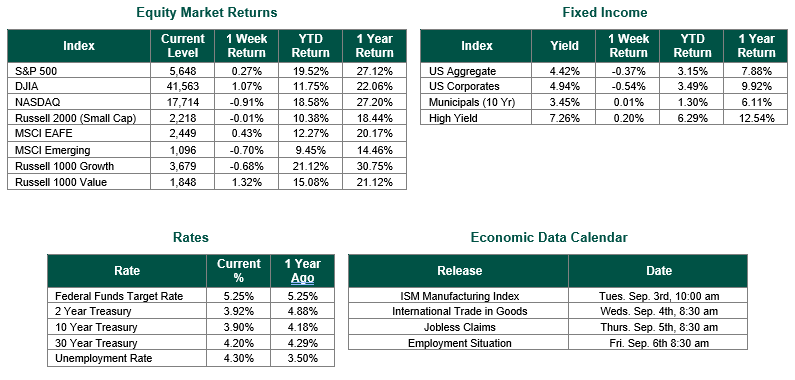
Global equity markets finished mixed for the week. In the U.S., the S&P 500 Index closed the week at a level of 5648, representing an increase of 0.27%, while the Russell Midcap Index moved 0.03% last week. Meanwhile, the Russell 2000 Index, a measure of the Nation’s smallest publicly traded firms, returned -0.01% over the week. As developed international equity performance and emerging markets were mixed, returning 0.43% and -0.70%, respectively. Finally, the 10-year U.S. Treasury yield moved higher, closing the week at 3.90%.
We hope that all our readers had an enjoyable Labor Day weekend. While most are saddened by the end of Summer, the economic data released in the week prior to Labor Day put smiles on most investors faces.
The positive data began on Monday with durable goods orders for July. New orders for manufactured durable goods surged by 9.9% from the prior month, making up for the downwardly revised 6.9% decline in the earlier period. The increase was the largest since May 2020 and firmly above consensus estimates of 4.5%. The results challenged the growing pessimism over manufacturing activity, suggesting the current slowdown may be temporary.
The Conference Board reported on Tuesday that its consumer confidence index rose to 103.3 in August from 101.9 in July. The index measures both Americans’ assessment of current economic conditions and their outlook for the next six months. The August results exceeded the consensus estimate of 100.1.
On Thursday, the Bureau of Economic Analysis issued the second estimate for second quarter GDP. Real gross domestic product (GDP) increased at an annual rate of 3.0%. Compared to the first quarter, the acceleration in GDP in the second quarter primarily reflected an upturn in private inventory investment and an acceleration in consumer spending.
The Commerce Department reported Friday, that the personal consumption expenditures price index rose 0.2% in July and 2.5% from the same period a year ago. The results were in line with the consensus estimates. Excluding volatile food and energy prices, core PCE also increased 0.2% for the month and 2.6% from a year ago. The annual result was slightly better than the 2.7% consensus estimate.
Following Fed Chair Powell’s comments from the Jackson Hole economic conference the prior week, the abundance of positive data moved equity markets higher to end the Summer. The focus will likely move to the August employment report due this Friday, as the last major data point prior to the much-anticipated FOMC meeting in mid-September.
Best wishes for the week ahead!
Durable goods data is sourced from the U.S. Census Bureau. Consumer Confidence data is sourced from the Conference Board. GDP data is sourced from the Bureau of Economic Analysis. PCE data is sourced from the Commerce Department. Economic Calendar Data from Econoday as of 8/16/24. International developed markets are measured by the MSCI EAFE Index, emerging markets are measured by the MSCI EM Index, and U.S. Large Caps are defined by the S&P 500 Index. Sector performance is measured using the GICS methodology.
Disclosures: Past performance does not guarantee future results. We have taken this information from sources that we believe to be reliable and accurate. Hennion and Walsh cannot guarantee the accuracy of said information and cannot be held liable. You cannot invest directly in an index. Diversification can help mitigate the risk and volatility in your portfolio but does not ensure a profit or guarantee against a loss.


