Last Week’s Markets in Review: The Fed, Q2 GDP, and Jobless Claims

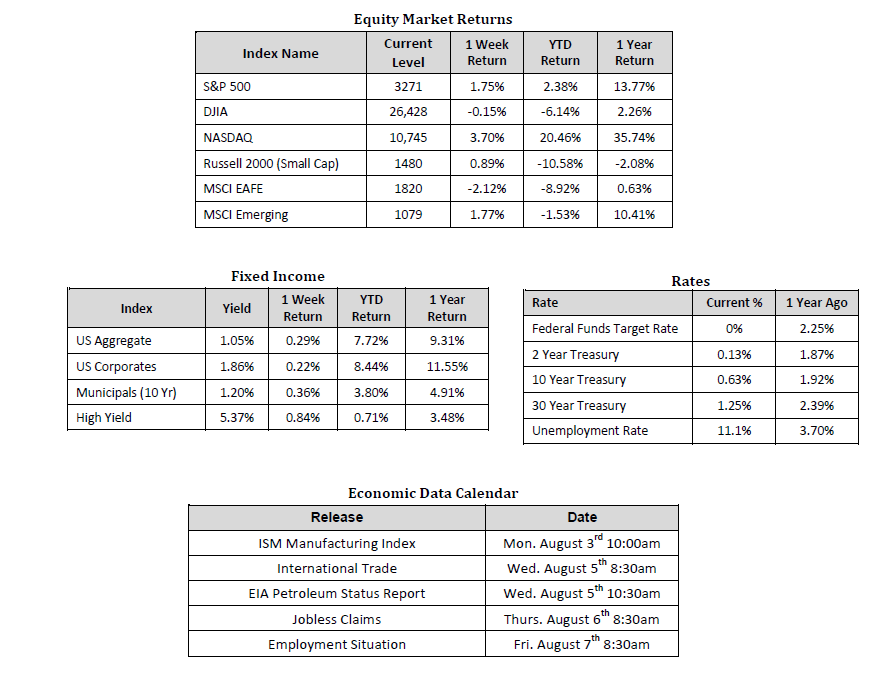
U.S equity markets rallied higher following a string of positive announcements on the economic data, and a continued commitment to maintain record low-interest rates by the Federal Reserve. In the U.S., the S&P 500 Index rose to a level of 3,271, representing a gain of 1.73%, while the Russell Midcap Index pushed 1.59% higher last week. Meanwhile, the Russell 2000 Index, a measure of the Nation’s smallest publicly traded firms, returned 0.88% over the week. Moreover, developed and emerging international markets returned -2.13% and 1.74%, respectively. Finally, the yield on the 10-year U.S. Treasury moved slightly lower, finishing the week at 0.63%.
The most significant quarterly Gross Domestic Product (GDP) contraction in U.S. history was widely anticipated across Wall Street for the second quarter, and Thursday’s initial reading of Q2 2020 GDP held to form, though it was better than expected. The 32.9% contraction for the second quarter beat consensus estimates calling for a 44% contraction, but still represented the largest drop in GDP on record since the Commerce Department began tracking data in the 1940s, and also marked the first back-to-back quarterly decline in GDP since 2008.
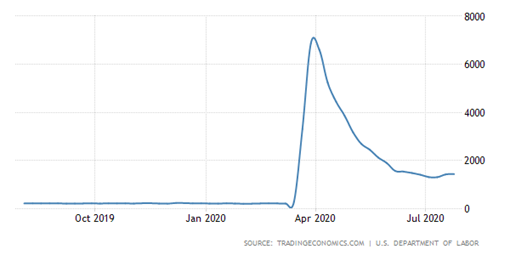
Initial jobless claims increased modestly to 1.43 million for the week ending July 25th, below estimates calling for 1.45 million claims but remaining stubbornly high as a result of the continued COVID-19 related restrictions. This now marks 19 straight weeks where initial jobless claims totaled at least 1 million and the second consecutive week in which initial claims rose, albeit modestly, after declining for 15 straight weeks.
United States Initial Jobless Claims (1 Year Time Period)

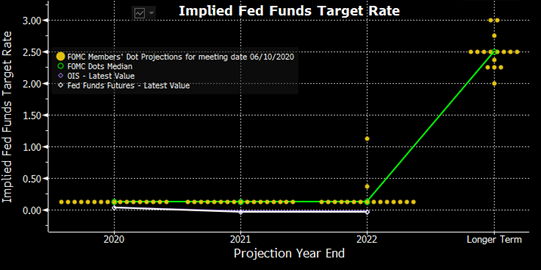
As expected, the Federal Reserve kept interest rates near zero on Wednesday and reiterated their stance of keeping rates at or near zero until the economy fully recovers from the COVID-19 pandemic, which, based on the most recent “Dot Plot” chart released by the Fed (see below) may not be until the end of 2022.
Federal Reserve’s Dot Plot Chart (as of June 10th, 2020)

The Federal Reserve also stated yesterday that they remain committed to using their full range of tools to support the U.S. economy as needed in this challenging environment. Many may remember Chairman Jerome Powell’s July 10th press conference where he assured all that the Fed “was not even thinking about thinking about raising rates.” The Chairman doubled down on that declaration during last week’s press conference when he asserted that the Fed was “not even thinking about thinking about thinking about raising rates.”
Finally, on the earnings front, with 63% of the companies in the S&P 500 reporting actual results, 84% of S&P 500 companies have reported a positive EPS surprise, and 69% have reported a positive revenue surprise for Q2 2020. While earnings expectations were meager, and in some cases, absent, for Q2 2020, the beat rates thus far are above historical averages. For instance, technology giants like Apple, Google, Facebook, and Amazon reported sales and earnings figures well above expectations.
Economic and earnings data continues to surprise to the upside, but let’s not forget the unprecedented buoy that’s been provided by the Federal Reserve and the Federal Government through massive monetary and fiscal support. At some point, one, or both, of these Federal entities may have less willingness or ability to fulfill such obligations, at which point asset class and geographic diversification will be crucial to accomplishing one’s long-term objectives. For this reason, we encourage investors to stay disciplined and work with experienced financial professionals to help manage their portfolios through various market cycles within an appropriately diversified framework that is consistent with their objectives, time-frame, and tolerance for risk.
We recognize that these are very troubling and uncertain times, and we want you to know that we are always here to help in any way we can. Please stay safe and stay well.
Sources for data in tables: Equity Market and Fixed Income returns are from JP Morgan as of 7/31/20. Rates and Economic Calendar Data from Bloomberg as of 7/31/20. International developed markets measured by the MSCI EAFE Index, emerging markets measured by the MSCI EM Index, U.S. Large Cap defined by the S&P 500. Sector performance is measured using GICS methodology.
Disclosures: Past performance does not guarantee future results. We have taken this information from sources that we believe to be reliable and accurate. Hennion and Walsh cannot guarantee the accuracy of said information and cannot be held liable. You cannot invest directly in an index.
Diversification can help mitigate the risk and volatility in your portfolio but does not ensure a profit or guarantee against loss.
Investing in commodities is not suitable for all investors. Exposure to the commodities markets may subject an investment to greater share price volatility than an investment in traditional equity or debt securities. Investments in commodities may be affected by changes in overall market movements, commodity index volatility, changes in interest rates or factors affecting a particular industry or commodity.
Products that invest in commodities may employ more complex strategies which may expose investors to additional risks.
Investing in fixed income securities involves certain risks such as market risk if sold prior to maturity and credit risk especially if investing in high yield bonds, which have lower ratings and are subject to greater volatility. All fixed income investments may be worth less than the original cost upon redemption or maturity. Bond Prices fluctuate inversely to changes in interest rates. Therefore, a general rise in interest rates can result in the decline of the value of your investment.
Definitions
MSCI- EAFE: The Morgan Stanley Capital International Europe, Australasia and Far East Index, a free float-adjusted market capitalization index that is designed to measure developed-market equity performance, excluding the United States and Canada.
MSCI-Emerging Markets: The Morgan Stanley Capital International Emerging Market Index, is a free float-adjusted market capitalization index that is designed to measure the performance of global emerging markets of about 25 emerging economies.
Russell 3000: The Russell 3000 measures the performance of the 3000 largest US companies based on total market capitalization and represents about 98% of the investible US Equity market.
ML BOFA US Corp Mstr [Merill Lynch US Corporate Master]: The Merrill Lynch Corporate Master Market Index is a statistical composite tracking the performance of the entire US corporate bond market over time.
ML Muni Master [Merill Lynch US Corporate Master]: The Merrill Lynch Municipal Bond Master Index is a broad measure of the municipal fixed income market.
Investors cannot directly purchase any index.
LIBOR, London Interbank Offered Rate, is the rate of interest at which banks offer to lend money to one another in the wholesale money markets in London.
The Dow Jones Industrial Average is an unweighted index of 30 “blue-chip” industrial U.S. stocks.
The S&P Midcap 400 Index is a capitalization-weighted index measuring the performance of the mid-range sector of the U.S. stock market and represents approximately 7% of the total market value of U.S. equities. Companies in the Index fall between S&P 500 Index and the S&P SmallCap 600 Index in size: between $1-4 billion.
DJ Equity REIT Index represents all publicly traded real estate investment trusts in the Dow Jones U.S. stock universe classified as Equity REITs according to the S&P Dow Jones Indices REIT Industry Classification Hierarchy. These companies are REITs that primarily own and operate income-producing real estate.


