Last Week’s Markets in Review: The Impact of Interest Rates on Equities

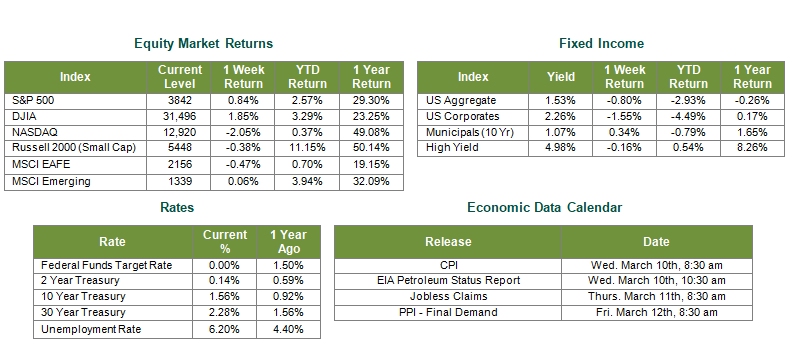
Major indexes were mixed during a choppy week for global equities. In the U.S., the S&P 500 Index rose to a level of 3,842, representing a gain of 0.84%, while the Russell Midcap Index moved 0.20% lower last week. Meanwhile, the Russell 2000 Index, a measure of the Nation’s smallest publicly traded firms, returned -0.38% over the week. International equities fluctuated throughout the week and developed and emerging markets returned -0.47% and 0.06%, respectively. Finally, the 10-year U.S. Treasury yield continued to move higher to 1.56%, increasing 12 basis points over the week.
Market volatility and media attention over the last few weeks have revolved around higher interest rates. While the Federal Reserve has essentially anchored the short-end of the curve for the foreseeable future, longer-dated treasuries have moved significantly. Just this year, the 10 year U.S. Treasury yield has climbed over 70% and closed last week yielding 1.56%. These movements come off a pandemic era low of 0.53% and aren’t far from pre-pandemic levels. Interest rates impact so many different areas of the economy on a macro and micro level that investors should understand how they affect various risk assets. While there tends to be a better understanding of the relationship between interest rates and bond prices, many investors do not grasp the potential impact that changes in interest rates may have on equities. As a result, investors may now be asking if the yield changes that have taken place already in 2021 have been the cause of recent stock market volatility?
Let’s start with reviewing why yields have risen so much thus far in 2021. According to JP Morgan, about 35% of the recent upswing in the 10 Year U.S. Treasury yield can be attributed to higher inflation expectations. The remainder is being derived from an increase in real yield. Real yield plus inflation expectations equal the nominal or stated yield. When real yields and inflation expectations are both rising, it’s generally a sign of a healthy or strengthening economy. If real rates were rising with falling inflation expectations, that would be concerning. This condition is typically seen during the later phases of an economic cycle, not the beginning phases of an economic expansion.
Additionally, if there were significant concerns over material changes to the Federal Reserve’s current position on interest rate policy, rates may rise and negatively impact growth. Regarding the latter, it is essential to remember the Fed’s dual mandate of promoting price stability and maximum employment. The Fed has made it clear that they will allow inflation to run above 2% for an extended period if necessary following their dual mandate and recently reaffirmed their accommodative stance with no intentions to raise the federal funds target rate anytime soon. As a result, an apparent disparity in interest rates between the bond markets and the Federal Reserve is currently in place.
This brings us to the recent volatility in equity markets. It’s hard to say that investors weren’t expecting rates to rise. However, perhaps what was unexpected is the timing and pace at which rates have risen. The hurried pace has been driven by a confluence of factors, namely improving macroeconomic data, vaccine approval/rollouts, and additional fiscal stimulus expectation. These factors created inflationary concerns and hence led to the subsequent rise in rates. In our view, the combination of these inflationary concerns and the current stretched valuations of the equity markets overall resulted in a spike in volatility. However, at this time, with think that this spike in volatility will be relatively short-lived.
It should be noted that the areas of the market that have pulled back the most of late are those growth-oriented sectors and those that are generally more impacted by rising rates. In contrast, the areas of the market most affected by COVID-19 and the more value-oriented areas have fared better. Even where we see some price pullbacks, for example, in the NASDAQ Composite Index, we note that pullbacks can be healthy when valuations are at historically high levels. We still see potential growth opportunities in technology stocks and innovation leaders, for example, within a recovering and expanding economy. We’re also encouraged by expanding breadth in terms of sector and style performance and remain bullish on U.S. equities while also appreciating the benefits that international equities can bring to a globally diversified portfolio.
As always, we continue to encourage investors to stay disciplined and work with experienced financial professionals to help manage their portfolios through various market cycles within an appropriately diversified framework that is consistent with their objectives, time-frame, and risk tolerance. Best wishes for the week ahead!
Sources for data in tables: Equity Market and Fixed Income returns are from JP Morgan as of 3/5/21. Rates and Economic Calendar Data from Bloomberg as of 3/5/21. International developed markets measured by the MSCI EAFE Index, emerging markets measured by the MSCI EM Index, U.S. Large Cap defined by the S&P 500. Sector performance is measured using the GICS methodology.
Disclosures: Past performance does not guarantee future results. We have taken this information from sources that we believe to be reliable and accurate. Hennion and Walsh cannot guarantee the accuracy of said information and cannot be held liable. You cannot invest directly in an index. Diversification can help mitigate the risk and volatility in your portfolio but does not ensure a profit or guarantee against a loss.
Diversification can help mitigate the risk and volatility in your portfolio but does not ensure a profit or guarantee against loss.
Investing in commodities is not suitable for all investors. Exposure to the commodities markets may subject an investment to greater share price volatility than an investment in traditional equity or debt securities. Investments in commodities may be affected by changes in overall market movements, commodity index volatility, changes in interest rates or factors affecting a particular industry or commodity.
Products that invest in commodities may employ more complex strategies which may expose investors to additional risks.
Investing in fixed income securities involves certain risks such as market risk if sold prior to maturity and credit risk especially if investing in high yield bonds, which have lower ratings and are subject to greater volatility. All fixed income investments may be worth less than the original cost upon redemption or maturity. Bond Prices fluctuate inversely to changes in interest rates. Therefore, a general rise in interest rates can result in the decline of the value of your investment.
Definitions
MSCI- EAFE: The Morgan Stanley Capital International Europe, Australasia and Far East Index, a free float-adjusted market capitalization index that is designed to measure developed-market equity performance, excluding the United States and Canada.
MSCI-Emerging Markets: The Morgan Stanley Capital International Emerging Market Index, is a free float-adjusted market capitalization index that is designed to measure the performance of global emerging markets of about 25 emerging economies.
Russell 3000: The Russell 3000 measures the performance of the 3000 largest US companies based on total market capitalization and represents about 98% of the investible US Equity market.
ML BOFA US Corp Mstr [Merill Lynch US Corporate Master]: The Merrill Lynch Corporate Master Market Index is a statistical composite tracking the performance of the entire US corporate bond market over time.
ML Muni Master [Merill Lynch US Corporate Master]: The Merrill Lynch Municipal Bond Master Index is a broad measure of the municipal fixed income market.
Investors cannot directly purchase any index.
LIBOR, London Interbank Offered Rate, is the rate of interest at which banks offer to lend money to one another in the wholesale money markets in London.
The Dow Jones Industrial Average is an unweighted index of 30 “blue-chip” industrial U.S. stocks.
The S&P Midcap 400 Index is a capitalization-weighted index measuring the performance of the mid-range sector of the U.S. stock market and represents approximately 7% of the total market value of U.S. equities. Companies in the Index fall between S&P 500 Index and the S&P SmallCap 600 Index in size: between $1-4 billion.
DJ Equity REIT Index represents all publicly traded real estate investment trusts in the Dow Jones U.S. stock universe classified as Equity REITs according to the S&P Dow Jones Indices REIT Industry Classification Hierarchy. These companies are REITs that primarily own and operate income-producing real estate.


