Last Week’s Markets in Review: The Potential Impact of Tapering and Rising Rates on Investments

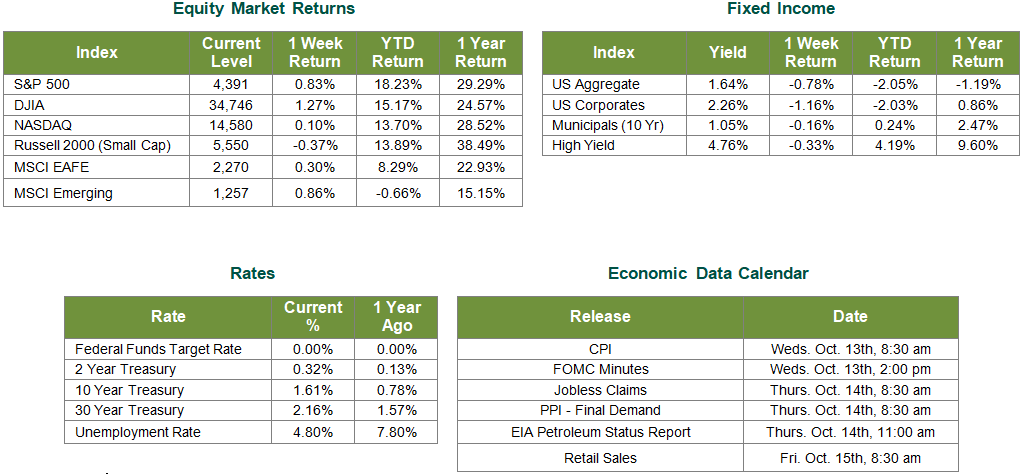
Global equity markets finished higher for the week. In the U.S., the S&P 500 Index traded higher in this week’s session and closed the week at a level of 4,391, representing a gain of 0.83%, while the Russell Midcap Index moved 0.62% higher last week. Meanwhile, the Russell 2000 Index, a measure of the Nation’s smallest publicly traded firms, returned -0.37% over the week. International equity performance was also higher as developed and emerging markets returned 0.30% and 0.86%, respectively. Finally, the 10-year U.S. Treasury yield ticked higher, closing the week at 1.61%.
Over the past few weeks, we have seen both equity and bond markets reacting adversely to concerns about the Federal Reserve expediting their tapering plans (i.e., cutting back on their current rate of $120 Billion a month of bond purchase) and potentially raising the federal funds’ target rate earlier than previously expected. These actions would presumably be enacted in an effort to help moderate the economy and prevent long-term above-average inflation. Investors, whether their capital is allocated to stocks, bonds, and even cash, have likely analyzed the potential impact that such events could have on their investments. But what is the actual cause and effect of raising rates or tapering from the Fed on investment portfolios? In this week’s update, we will dissect this occurrence and help our readers understand what may, or may not, happen to their investments.
In a stunning press conference by Jerome Powell back on Sunday, March 15th, 2020, the Federal Reserve announced that it had no choice but to aggressively begin quantitative easing through the purchase of billions of dollars worth of U.S. Treasury bonds and mortgage-backed securities as well as reduce the fed funds interest rate to zero to help stimulate the pandemic punished economy. Equity holders and corporations alike have been beneficiaries of these Federal Reserve actions. Low rates have allowed many corporations to borrow cheaply and deploy their free cash flow throughout their businesses, helping to boost corporate profits. At the same time, with interest rates remaining at historic lows, equities have become a preferred asset class over bonds to some investors, creating inflows into the stocks of a wide variety of public companies. The results from quantitative easing are astonishing as represented in the chart below, as equity returns as measured by the S&P 500 Index, have returned 66.11% since the Fed announcement last March.

So what will happen when tapering begins and the Fed starts to raise the federal funds’ target rate? Contrary to what many investors believe, falling stock prices are not directly associated with rising rates. In fact, during previous periods of rising rates, stocks have performed better historically than they did when rates were falling due likely to the market’s perception of improving economic conditions. However, if rates rise at a faster pace than expected the future cash flows of corporations may become significantly altered.
Tapering and rising rates will likely have a different effect on the bond market. As interest rates rise the prices of bonds generally fall, as they are inversely related. If the speed at which rates are increasing is slow, it is possible that earnings from the income that bonds produce could offset the negative price fluctuations from rising rates. However, if the rise occurs too quickly the market may perceive the future cash flows of those investments to not be worth holding and cause downward pressure on the price of bonds. As tapering begins, we believe that the Fed will gradually decrease its weekly amount of bond purchases, generating increased levels of supply for the rest of the market. If the demand does not match the future supply of bonds, then prices should fall and yields, in turn, will rise.
It is important to note that the outcome of tapering and rising rates on both bond and equity markets is not guaranteed. New economic developments or changes in the pandemic recovery could also change the Fed’s future decisions on both fronts as Fed Chair Powell has consistently reminded investors that their decisions are “data-dependent.” There is also the possibility that the market may not react how it has historically to such events. For these reasons, we believe that it is becoming increasingly important for investors to speak with experienced financial professionals to help ensure that their portfolios are being managed in accordance with their own specific risk appetite, investment timeframes, and objectives.
Equity Market and Fixed Income returns are from JP Morgan as of 10/8/21. Rates and Economic Calendar Data from Bloomberg as of 10/8/21. International developed markets measured by the MSCI EAFE Index, emerging markets measured by the MSCI EM Index, U.S. Large Cap defined by the S&P 500. Sector performance is measured using the GICS methodology.
Disclosures: Past performance does not guarantee future results. We have taken this information from sources that we believe to be reliable and accurate. Hennion and Walsh cannot guarantee the accuracy of said information and cannot be held liable. You cannot invest directly in an index. Diversification can help mitigate the risk and volatility in your portfolio but does not ensure a profit or guarantee against a loss.
Diversification can help mitigate the risk and volatility in your portfolio but does not ensure a profit or guarantee against loss.
Investing in commodities is not suitable for all investors. Exposure to the commodities markets may subject an investment to greater share price volatility than an investment in traditional equity or debt securities. Investments in commodities may be affected by changes in overall market movements, commodity index volatility, changes in interest rates or factors affecting a particular industry or commodity.
Products that invest in commodities may employ more complex strategies which may expose investors to additional risks.
Investing in fixed income securities involves certain risks such as market risk if sold prior to maturity and credit risk especially if investing in high yield bonds, which have lower ratings and are subject to greater volatility. All fixed income investments may be worth less than the original cost upon redemption or maturity. Bond Prices fluctuate inversely to changes in interest rates. Therefore, a general rise in interest rates can result in the decline of the value of your investment.
Definitions
MSCI- EAFE: The Morgan Stanley Capital International Europe, Australasia and Far East Index, a free float-adjusted market capitalization index that is designed to measure developed-market equity performance, excluding the United States and Canada.
MSCI-Emerging Markets: The Morgan Stanley Capital International Emerging Market Index, is a free float-adjusted market capitalization index that is designed to measure the performance of global emerging markets of about 25 emerging economies.
Russell 3000: The Russell 3000 measures the performance of the 3000 largest US companies based on total market capitalization and represents about 98% of the investible US Equity market.
ML BOFA US Corp Mstr [Merill Lynch US Corporate Master]: The Merrill Lynch Corporate Master Market Index is a statistical composite tracking the performance of the entire US corporate bond market over time.
ML Muni Master [Merill Lynch US Corporate Master]: The Merrill Lynch Municipal Bond Master Index is a broad measure of the municipal fixed income market.
Investors cannot directly purchase any index.
LIBOR, London Interbank Offered Rate, is the rate of interest at which banks offer to lend money to one another in the wholesale money markets in London.
The Dow Jones Industrial Average is an unweighted index of 30 “blue-chip” industrial U.S. stocks.
The S&P Midcap 400 Index is a capitalization-weighted index measuring the performance of the mid-range sector of the U.S. stock market, and represents approximately 7% of the total market value of U.S. equities. Companies in the Index fall between S&P 500 Index and the S&P SmallCap 600 Index in size: between $1-4 billion.
DJ Equity REIT Index represents all publicly traded real estate investment trusts in the Dow Jones U.S. stock universe classified as Equity REITs according to the S&P Dow Jones Indices REIT Industry Classification Hierarchy. These companies are REITs that primarily own and operate income-producing real estate.


