Last Week’s Markets in Review: Treasuries Reach Yields Last Seen in 2007

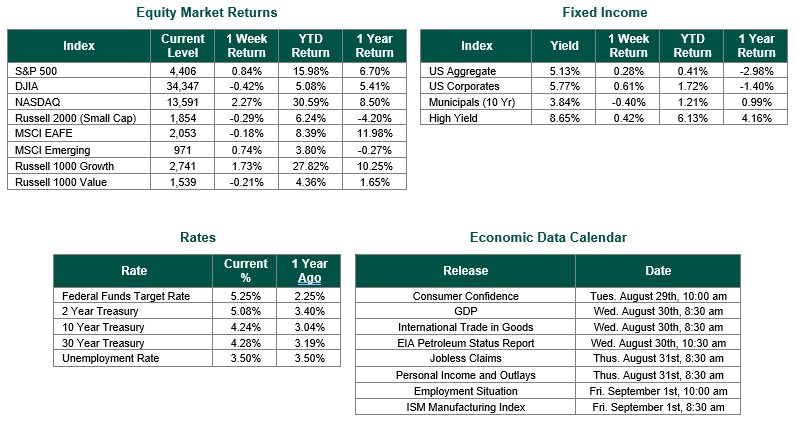
Global equity markets finished lower for the week. In the U.S., the S&P 500 Index closed the week at a level of 4,224, representing a loss of 2.38%, while the Russell Midcap Index moved -3.33% last week. Meanwhile, the Russell 2000 Index, a measure of the Nation’s smallest publicly traded firms, returned -2.25% over the week. As developed international equity performance and emerging markets were lower, returning -2.59% and -2.69%, respectively. Finally, the 10-year U.S. Treasury yield moved higher, closing the week at 4.91%.
For the first time since 2007, just before the commencement of the global financial crisis, the 10-year U.S. Treasury reached a yield of 5% this past week. Despite global tensions that would typically drive a flight to safety, and hence investment flows into U.S. Treasuries, forcing yields lower, other economic forces have outweighed the shelter of U.S. credit and pushed yields higher. The shift in yields has market participants concerned about the future and whether the outcome will be the same as when we last witnessed yields trading this high. However, the landscape of the markets today is shaped in a completely different way than in 2007, albeit with some similarities. Here is where we currently stand compared to 2007:
• As 2007 progressed, the subprime mortgage crisis in the United States continued to escalate. This crisis profoundly impacted the financial system, as numerous financial institutions faced substantial losses on mortgage-related assets, which, in turn, affected the broader credit markets. Today, the risks of a subprime mortgage crisis are virtually non-existent and not part of the current interest rate equation.
• In response to the deepening financial crisis, the Federal Reserve continued to act throughout 2007. Then Federal Reserve Chair Ben Bernanke reduced the Federal Funds Target Rate several times throughout the year to provide liquidity to the financial system and support economic stability. Today, monetary policies are backward from 2007, as the Federal Reserve continues to increase the Federal Funds Target Rate with historic aggression to cool economic growth. As Fed Chair Jerome Powell stated this past week, “Does it feel like policy is too tight right now? I would have to say no,”.
• In 2007, the U.S. housing market continued to deteriorate, with falling home prices, increased foreclosure rates, and a glut of unsold homes. This housing market downturn was a significant driver of the broader financial crisis. Despite the recent softening in housing demand from mortgage rates that have touched 8%, the housing market is dealing with a significant supply crunch and high demand, quite the opposite of the events that unfolded in 2007.
• The financial crisis that originated in the United States had global implications. Banks and financial institutions worldwide were exposed to the risky assets tied to the U.S. housing market. This exposure led to a global credit squeeze and financial instability, impacting economies worldwide. In 2023, we face the global implications of ongoing inflation and the response of central banks around the world. While some financial institutions have been exposed to long-duration securities that crushed their balance sheets as yields have risen, the assets owned by these institutions are not the same as those held in 2007.
• After the 10-year U.S. Treasury yield hit 5% in 2007, the year was marked by the intensification of the financial crisis, actions by the Federal Reserve to address the crisis, market turmoil, and a deepening economic recession.
Despite the differences, the outcome remains to be seen. Will a 5% 10-year U.S. Treasury yield lead to another U.S. recession, or will the contrasting events be enough to prevent economic turmoil? We do know that there does not appear to be a perfect blueprint for what investors can expect. We have learned during this market update and throughout history that movements in U.S. Treasuries can come from vastly different events and variables, and markets can move in different directions than the economy.
Best wishes for the week ahead!
Equity Market, Fixed Income returns, and rates are from Bloomberg as of 10/20/23. Economic Calendar Data from Econoday as of 10/20/23. International developed markets are measured by the MSCI EAFE Index, emerging markets are measured by the MSCI EM Index, and U.S. Large Caps are defined by the S&P 500 Index. Sector performance is measured using the GICS methodology.
Disclosures: Past performance does not guarantee future results. We have taken this information from sources that we believe to be reliable and accurate. Hennion and Walsh cannot guarantee the accuracy of said information and cannot be held liable. You cannot invest directly in an index. Diversification can help mitigate the risk and volatility in your portfolio but does not ensure a profit or guarantee against a loss.


