Last Week’s Markets in Review: U.S. Economy Rebounds Strongly in 3rd Quarter

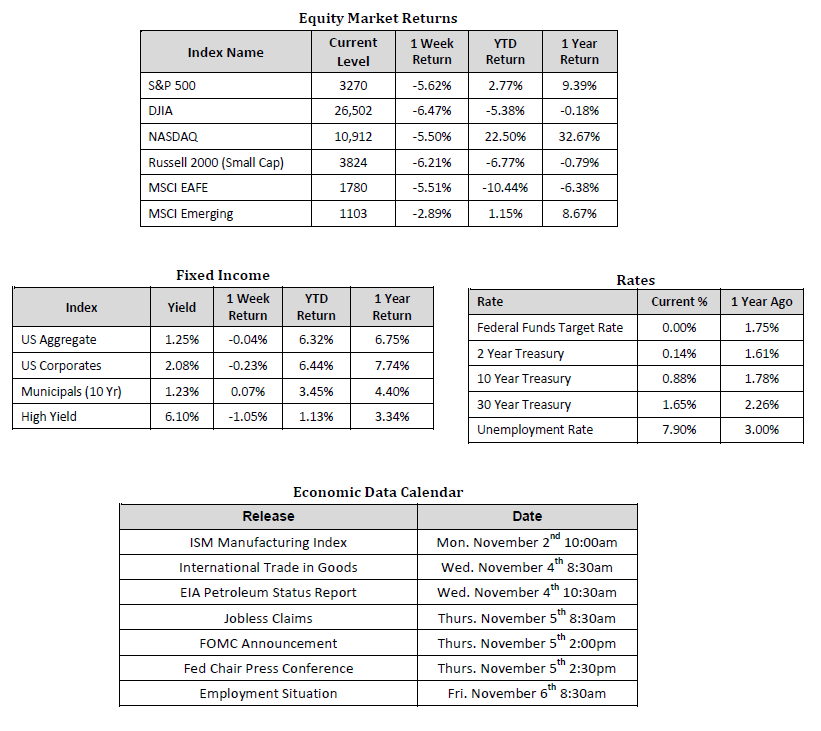
Global equity markets retreated during the last trading week of October. In the U.S., the S&P 500 Index fell to a level of 3,270, representing a loss of 5.62%, while the Russell Midcap Index moved 5.64% lower last week. Meanwhile, the Russell 2000 Index, a measure of the Nation’s smallest publicly traded firms, fell 6.21% over the week. International equities were unable to buck the trend as developed and emerging markets returned -5.51% and -2.89%, respectively. Finally, the yield on the 10-year U.S. Treasury increased slightly, finishing the week at 0.88%, up 3 basis points from the week prior.
Last week was quite a whirlwind. The swift decline in U.S. markets noted above marked the worst trading week in seven months. A resurgence in COVID-19 cases across the globe worried investors about the potential reimplementation of lockdown measures to further limit the spread of COVID-19. This fear of further restrictions, along with policymakers’ failure to agree on additional fiscal stimulus ahead of the November 3 elections, sparked selling pressure. As a full “return to normal” scenario may have been pushed further down the road, it’s crucial for us as investment professionals to look through emotional trading and short-term market swings. Instead, we take stock of the economy and business cycle as a whole to help determine our longer-term strategies and investment decisions. We’ve long contended that a sustained and complete economic recovery is highly dependent on COVID-19 data and vaccine developments. That has not changed, however, if we can reasonably determine that the economy is on a solid footing, supported by positively trending fundamentals, this should be conducive to medium to long-term growth potential. It starts with Gross Domestic Product (GDP), a broad measure of domestic production and economic health.
On Thursday of last week, the initial reading of third-quarter U.S. GDP increased at an annualized rate of 33.1%. This increase not only came in well above consensus expectations of 30.9% but also represented the fastest growth rate in history. The advance was driven by a record 40.7% increase in consumer spending, a crucial factor in U.S. economic growth. In contrast to last quarter’s 31.4% decline, the “bounceback” represents quantifiable steps to recovery from the COVID-19 lockdowns that were put in place earlier in the year. In effect, this year is unique in that we’re not necessarily taking measure of a normal contraction or expansion within a certain time period or bull/bear market cycle. Instead, we’re determining the country’s ability to re-open and re-engage activity following mandatory lockdown measures which drove the 31.4% decline in the prior quarter. Re-openings have produced some strong results thus far and are supportive of the significant stock market movements off the March lows. However, compared to last year, total economic output in 2020 is still expected to fall by about 3.5%. Some industries remain crippled by COVID-19 related hardships, so there is room for improvement, but it’s unlikely to translate to a swift recovery in real potential GDP. The next two quarters will be interesting to observe. As it stands today, consensus annualized growth rates for 4Q20 and 1Q21 are 4.0% and 3.7%, respectively.
In the corporate arena, earnings season is well underway. Here is a snapshot of earnings and revenue surprises in total and by sector thus far for the third quarter of 2020:

Source: Bloomberg 11/2/20
As you can see, the “beats” are coming in strong across a majority of the GICS sectors. Certainly a strong signal, however, forward guidance will likely prove more impactful in the current market environment. Take Microsoft, for example, who beat on the top and bottom line. The results were overshadowed by soft revenue guidance and a broad market selloff following their earnings release, which sent their shares lower.
In addition, last week’s update on jobless claims was lower than expected. Initial jobless claims were 751,000 compared to an expected 770,000 while continuing jobless claims came in at 7.75 million vs 7.78 million expected. Durable goods orders also significantly beat expectations. While consumer confidence fell slightly in October, we recognize that the reading is forward-looking and measures views on business conditions, employment, and income. With Election Day now upon us and with several other risks and uncertainties present, the slight decline does not discourage nor surprise us.
Recognizing that GDP and corporate earnings are lagging data points, the Conference Board U.S. Leading Index can also be a helpful statistic to observe as it tracks ten leading economic indicators. The most recent monthly release showed the index has increased for five consecutive months, while the diffusion index, which measures the dispersion within the underlying indicators, strengthened. It seems reasonable to come to the conclusion that the economy is currently standing on relatively solid footing, given consistent, widespread, improvement in most leading economic indicators, coupled with persistent upside surprises in revenue and EPS figures. One potential risk to this outlook comes from the potential imposition of nationwide lockdown measures to help combat COVID-19.
We continue to encourage investors to stay disciplined and work with experienced financial professionals to help manage their portfolios through various market cycles within an appropriately diversified framework that is consistent with their objectives, time-frame, and risk tolerance.
We recognize that these are very troubling and uncertain times, and we want you to know that we are always here for you to help in any way that we can. Please stay safe and stay well.
Sources for data in tables: Equity Market and Fixed Income returns are from JP Morgan as of 10/30/20. Rates and Economic Calendar Data from Bloomberg as of 10/30/20. International developed markets measured by the MSCI EAFE Index, emerging markets measured by the MSCI EM Index, U.S. Large Cap defined by the S&P 500. Sector performance is measured using the GICS methodology.
Diversification can help mitigate the risk and volatility in your portfolio but does not ensure a profit or guarantee against loss.
Investing in commodities is not suitable for all investors. Exposure to the commodities markets may subject an investment to greater share price volatility than an investment in traditional equity or debt securities. Investments in commodities may be affected by changes in overall market movements, commodity index volatility, changes in interest rates or factors affecting a particular industry or commodity.
Products that invest in commodities may employ more complex strategies which may expose investors to additional risks.
Investing in fixed income securities involves certain risks such as market risk if sold prior to maturity and credit risk especially if investing in high yield bonds, which have lower ratings and are subject to greater volatility. All fixed income investments may be worth less than the original cost upon redemption or maturity. Bond Prices fluctuate inversely to changes in interest rates. Therefore, a general rise in interest rates can result in the decline of the value of your investment.
Definitions
MSCI- EAFE: The Morgan Stanley Capital International Europe, Australasia and Far East Index, a free float-adjusted market capitalization index that is designed to measure developed-market equity performance, excluding the United States and Canada.
MSCI-Emerging Markets: The Morgan Stanley Capital International Emerging Market Index, is a free float-adjusted market capitalization index that is designed to measure the performance of global emerging markets of about 25 emerging economies.
Russell 3000: The Russell 3000 measures the performance of the 3000 largest US companies based on total market capitalization and represents about 98% of the investible US Equity market.
ML BOFA US Corp Mstr [Merill Lynch US Corporate Master]: The Merrill Lynch Corporate Master Market Index is a statistical composite tracking the performance of the entire US corporate bond market over time.
ML Muni Master [Merill Lynch US Corporate Master]: The Merrill Lynch Municipal Bond Master Index is a broad measure of the municipal fixed income market.
Investors cannot directly purchase any index.
LIBOR, London Interbank Offered Rate, is the rate of interest at which banks offer to lend money to one another in the wholesale money markets in London.
The Dow Jones Industrial Average is an unweighted index of 30 “blue-chip” industrial U.S. stocks.
The S&P Midcap 400 Index is a capitalization-weighted index measuring the performance of the mid-range sector of the U.S. stock market and represents approximately 7% of the total market value of U.S. equities. Companies in the Index fall between S&P 500 Index and the S&P SmallCap 600 Index in size: between $1-4 billion.
DJ Equity REIT Index represents all publicly traded real estate investment trusts in the Dow Jones U.S. stock universe classified as Equity REITs according to the S&P Dow Jones Indices REIT Industry Classification Hierarchy. These companies are REITs that primarily own and operate income-producing real estate.


