Last Week’s Markets in Review: Understanding Value-oriented Investments

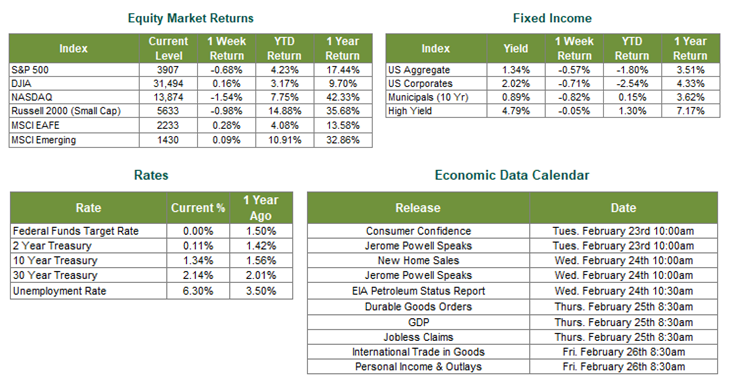
Global equity markets produced flat to moderately negative returns on the week, with U.S. equities trailing international equities. In the U.S., the S&P 500 Index fell to a level of 3,907, representing a 0.68% loss, while the Russell Midcap Index followed suit, falling 0.13%. Meanwhile, the Russell 2000 Index, a measure of the Nation’s smallest publicly traded firms, dropped 0.98% lower over the week. Moreover, developed and emerging international markets returned 0.28% and 0.09%, respectively. Finally, the 10-year U.S. Treasury moved to 1.34%, fourteen basis point higher than the prior week.
In economic news, January retail sales figures surprised to the upside in a big way. January retail sales rose 5.3% compared to the consensus expectation for a 1.1% increase. A continuation of this trend in February will serve as confirmation that we’re in the early innings of what could be a robust economic recovery. Despite continued signs that an economic recovery is underway, weekly initial jobless claims disappointed last week with 861,000 claims filed compared to consensus expectations for 773,000 claims.
In week’s past, we’ve discussed the connection between value-oriented stocks and economic expansions. We noted that stocks typically viewed as expressing value characteristics have historically outperformed the broader market during periods of economic expansion. As such, we thought it would be useful to define the elements that usually represent value stocks, discuss some of the behavioral factors that have offered justifications for value’s outperformance over growth in the past, and expand on the rationale supporting a preference for value stocks during an economic expansion.
Let’s first address the fundamental ratios used to discern whether a stock should be categorized as value, as opposed to growth or core. Value-oriented stocks often have higher relative dividend yields, low price-to-book ratios, and/or low P/E (price-to-earnings) ratios. They typically trade at a lower price relative to their fundamentals and are thus considered undervalued. Analyzing a company’s fundamentals by reviewing its balance sheet, income statement, and cash-flow statement may help determine if a company should be categorized as value. However, it doesn’t necessarily explain why the market tagged the company with a lower valuation premium than its peers.
For this type of explanation, we have to turn to behavioral finance, which argues that markets, and by extension market participants, act irrationally at times. In other words, investors may let emotions impact decision-making, which can lead to suboptimal outcomes. Investopedia defines behavioral finance as proposing that psychological influences and biases affect the financial behaviors of investors and financial practitioners. An example of this is “Herd Behavior,” which states that investors mimic the financial behaviors of the majority or “the herd.” This behavioral quirk can partially explain the return premium that value investors have historically captured. Bad news may be initially perceived as more dire than it is, leading to a herd of investors selling the company’s stock, which results in a low stock price relative to the company’s true fundamentals. Over time, as investors make sense of all of the information available, they may realize that the company in question was on more solid financial ground than had previously been recognized, leading to a herd of investors rushing back into the stock. As a result, those investors who chose to invest in this particular company when it was out of favor with the broader market were able to generate a value return premium.
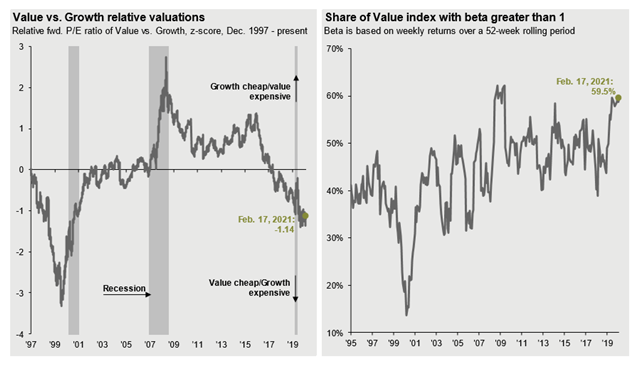
Finally, as we alluded to earlier, we believe that we are firmly entering the expansionary phase of the economic cycle. During this phase, stocks that have exhibited more cyclicality have outperformed the broader market historically. As you can see from the graphic below, nearly 60% of the Russell 1000 Value Index companies are considered cyclical. What may be even more enticing than the favorable macroeconomic dynamics at play for those considering additional exposure to value-oriented stocks are current valuations relative to growth-oriented stocks. The relative forward P/E ratio of value stocks and growth stocks is at its lowest level since the midst of the tech-bubble in 2000, suggesting that value may currently be inexpensive and growth may currently be expensive.

Regular readers will know that we strongly discourage attempts to time the stock market and ultimately believe that doing so produces less than ideal results for investors. With that said, minor allocation adjustments can be made to take advantage of perceived mispricing, as we’ve identified in the value segment of the stock market, but being able to do so effectively is contingent upon a properly diversified portfolio already being in place. If significant imbalances are currently present, implementing a new overweight toward value stocks may not have the desired effect. As such, we continue to encourage investors to stay disciplined and work with experienced financial professionals to help build and manage the asset allocations within their portfolios consistent with their objectives, timeframe, and tolerance for risk.
Best wishes for the week ahead!
Disclosures: Past performance does not guarantee future results. We have taken this information from sources that we believe to be reliable and accurate. Hennion and Walsh cannot guarantee the accuracy of said information and cannot be held liable. You cannot invest directly in an index. Diversification can help mitigate the risk and volatility in your portfolio but does not ensure a profit or guarantee against a loss.
Other Data Sources: Equity Market and Fixed Income returns are from JP Morgan as of 2/19/20. Rates and Economic Calendar Data from Bloomberg as of 2/19/20. International developed markets measured by the MSCI EAFE Index, emerging markets measured by the MSCI EM Index, U.S. Large Cap defined by the S&P 500. Sector performance is measured using GICS methodology. S&P 500 sector performance represents total return figures sourced from Bloomberg. The growth vs. value chart was sourced from J.P. Morgan’s Guide to the Markets.
Diversification can help mitigate the risk and volatility in your portfolio but does not ensure a profit or guarantee against loss.
Investing in commodities is not suitable for all investors. Exposure to the commodities markets may subject an investment to greater share price volatility than an investment in traditional equity or debt securities. Investments in commodities may be affected by changes in overall market movements, commodity index volatility, changes in interest rates or factors affecting a particular industry or commodity.
Products that invest in commodities may employ more complex strategies which may expose investors to additional risks.
Investing in fixed income securities involves certain risks such as market risk if sold prior to maturity and credit risk especially if investing in high yield bonds, which have lower ratings and are subject to greater volatility. All fixed income investments may be worth less than the original cost upon redemption or maturity. Bond Prices fluctuate inversely to changes in interest rates. Therefore, a general rise in interest rates can result in the decline of the value of your investment.
Definitions
MSCI- EAFE: The Morgan Stanley Capital International Europe, Australasia and Far East Index, a free float-adjusted market capitalization index that is designed to measure developed-market equity performance, excluding the United States and Canada.
MSCI-Emerging Markets: The Morgan Stanley Capital International Emerging Market Index, is a free float-adjusted market capitalization index that is designed to measure the performance of global emerging markets of about 25 emerging economies.
Russell 3000: The Russell 3000 measures the performance of the 3000 largest US companies based on total market capitalization and represents about 98% of the investible US Equity market.
ML BOFA US Corp Mstr [Merill Lynch US Corporate Master]: The Merrill Lynch Corporate Master Market Index is a statistical composite tracking the performance of the entire US corporate bond market over time.
ML Muni Master [Merill Lynch US Corporate Master]: The Merrill Lynch Municipal Bond Master Index is a broad measure of the municipal fixed income market.
Investors cannot directly purchase any index.
LIBOR, London Interbank Offered Rate, is the rate of interest at which banks offer to lend money to one another in the wholesale money markets in London.
The Dow Jones Industrial Average is an unweighted index of 30 “blue-chip” industrial U.S. stocks.
The S&P Midcap 400 Index is a capitalization-weighted index measuring the performance of the mid-range sector of the U.S. stock market and represents approximately 7% of the total market value of U.S. equities. Companies in the Index fall between S&P 500 Index and the S&P SmallCap 600 Index in size: between $1-4 billion.
DJ Equity REIT Index represents all publicly traded real estate investment trusts in the Dow Jones U.S. stock universe classified as Equity REITs according to the S&P Dow Jones Indices REIT Industry Classification Hierarchy. These companies are REITs that primarily own and operate income-producing real estate.


