Last Week’s Markets in Review: What a Yield Curve Inversion May Mean for the Markets

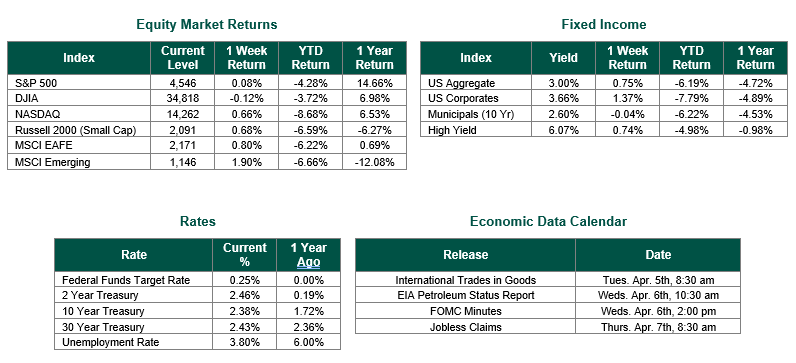
Global equity markets finished lower for the week. In the U.S., the S&P 500 Index closed the week at a level of 4,488, representing a loss of 1.24%, while the Russell Midcap Index moved 2.15% lower last week. Meanwhile, the Russell 2000 Index, a measure of the Nation’s smallest publicly traded firms, returned -4.60% over the week. International equity performance was slightly lower as developed and emerging markets returned -1.36% and -1.53%, respectively. Finally, the 10-year U.S. Treasury yield moved higher, closing the week at 2.70%.
According to the Merriam-Webster dictionary, an inversion is a reversal of position, order, form, or relationship. For decades this word, used in conjunction with the yield curve, has haunted markets as a leading indicator of an economic recession. Today the term has been screamed across headlines to market participants, leaving many uneasy with their current investments. In this week’s market update, we will focus on yield curve inversions, both past and present, and explain to our readers what this data is telling the markets.
What is a yield curve inversion? The typical yield curve will exhibit upward sloping characteristics in which short-term bonds trade at lower yields than longer-dated bonds due to investors requiring higher interest rates for long-term inflation and future economic growth. Yield curve inversion exists when yields on shorter-dated U.S. Treasuries trade higher than on their longer-dated U.S. Treasuries. This situation can occur when investors feel more uncertain about the current economy than they do about the future economy. Typically, the focus is on the 2-year and 10-year U.S. Treasuries when looking at yield curve inversion.
Why do investors get concerned when inversions occur? Historically, the positive correlation between yield curve inversion and a forthcoming recessionary period signal has been high. In fact, since 1955, whenever the 2-year/10-year U.S Treasury curve (as mentioned above) had inverted, the economy had followed with a recessionary period in all but one of the occurrences, according to the Federal Reserve Bank of San Francisco.
Is a recession now imminent based on the recent curve inversion? Not necessarily. Aside from the fact that the inversion no longer exists as of this morning, if we take the previous data from the Federal Reserve Bank of San Francisco and expand it further back to 1900, there have been 28 different 2-year/10-year inversions. Within those events, a recession followed 78% of the time. While this data may not help ease the mind of investors, the next statistic might. Of all the recessions preceded by a yield curve inversion, a recession did not occur until 22 months later, on average. In addition, LPL reviewed the past four yield curve inversions and noted the S&P 500 index, on average, rallied for another 17 months and gained nearly 29%.
The bottom line is that a yield curve inversion has proven to be a strong leading indicator of a recessionary period. Still, investors should be cautious about changing their portfolio strategies due to a yield curve inversion alone. Based on recent economic data, the U.S. economy appears to be healthy, with short end yield movements being a byproduct of tightening monetary policy in the face of record inflationary pressures. While a recessionary period cannot be ruled out in the future and is generally part of historical business cycles, t does not appear likely to occur soon.
It is important during these times to remind investors of the importance of focusing on time in the market and not timing the market. Remaining disciplined and working with investment professionals to ensure portfolios align with your objectives, risk tolerance, and time horizon is of the utmost importance. We expect the next 10 years of investing to be drastically different from the past 10 years.
Best wishes for the week ahead!
Equity Market and Fixed Income returns are from JP Morgan as of 4/8/22. Rates and Economic Calendar Data from Bloomberg as of 4/8/22. International developed markets measured by the MSCI EAFE Index, emerging markets measured by the MSCI EM Index, U.S. Large Cap is defined by the S&P 500. Sector performance is measured using the GICS methodology.
Disclosures: Past performance does not guarantee future results. We have taken this information from sources that we believe to be reliable and accurate. Hennion and Walsh cannot guarantee the accuracy of said information and cannot be held liable. You cannot invest directly in an index. Diversification can help mitigate the risk and volatility in your portfolio but does not ensure a profit or guarantee against a loss.
Diversification can help mitigate the risk and volatility in your portfolio but does not ensure a profit or guarantee against loss.
Investing in commodities is not suitable for all investors. Exposure to the commodities markets may subject an investment to greater share price volatility than an investment in traditional equity or debt securities. Investments in commodities may be affected by changes in overall market movements, commodity index volatility, changes in interest rates or factors affecting a particular industry or commodity.
Products that invest in commodities may employ more complex strategies which may expose investors to additional risks.
Investing in fixed income securities involves certain risks such as market risk if sold prior to maturity and credit risk, especially if investing in high yield bonds, which have lower ratings and are subject to greater volatility. All fixed income investments may be worth less than the original cost upon redemption or maturity. Bond Prices fluctuate inversely to changes in interest rates. Therefore, a general rise in interest rates can result in the decline of the value of your investment.
Definitions
MSCI- EAFE: The Morgan Stanley Capital International Europe, Australasia and Far East Index, a free float-adjusted market capitalization index that is designed to measure developed-market equity performance, excluding the United States and Canada.
MSCI-Emerging Markets: The Morgan Stanley Capital International Emerging Market Index, is a free float-adjusted market capitalization index that is designed to measure the performance of global emerging markets of about 25 emerging economies.
Russell 3000: The Russell 3000 measures the performance of the 3000 largest US companies based on total market capitalization and represents about 98% of the investible US Equity market.
ML BOFA US Corp Mstr [Merill Lynch US Corporate Master]: The Merrill Lynch Corporate Master Market Index is a statistical composite tracking the performance of the entire US corporate bond market over time.
ML Muni Master [Merill Lynch US Corporate Master]: The Merrill Lynch Municipal Bond Master Index is a broad measure of the municipal fixed income market.
Investors cannot directly purchase any index.
LIBOR, London Interbank Offered Rate, is the rate of interest at which banks offer to lend money to one another in the wholesale money markets in London.
The Dow Jones Industrial Average is an unweighted index of 30 “blue-chip” industrial U.S. stocks.
The S&P Midcap 400 Index is a capitalization-weighted index measuring the performance of the mid-range sector of the U.S. stock market and represents approximately 7% of the total market value of U.S. equities. Companies in the Index fall between S&P 500 Index and the S&P SmallCap 600 Index in size: between $1-4 billion.
DJ Equity REIT Index represents all publicly traded real estate investment trusts in the Dow Jones U.S. stock universe classified as Equity REITs according to the S&P Dow Jones Indices REIT Industry Classification Hierarchy. These companies are REITs that primarily own and operate income-producing real estate.


