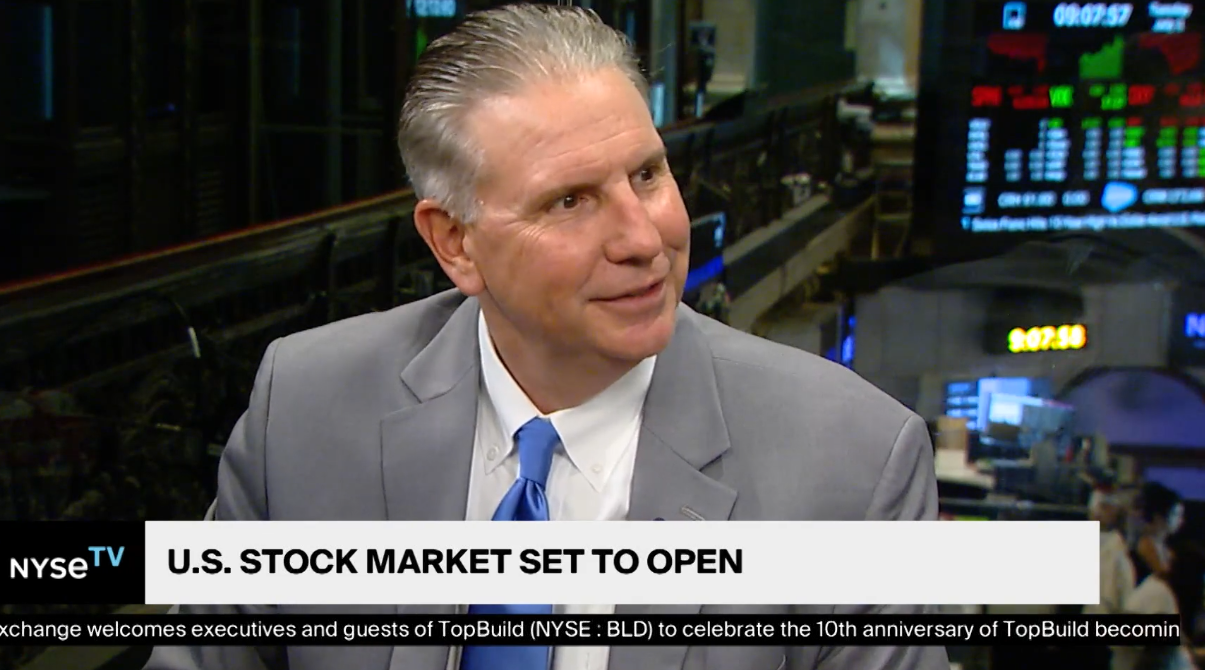
Last Week’s Markets in Review: What Comes After the 10th Fed Rate Hike?

Global equity markets finished slightly lower for the week. In the U.S., the S&P 500 Index closed the week at a level of 4,124, representing a decrease of -0.24%, while the Russell Midcap Index moved -1.02% lower last week. Meanwhile, the Russell 2000 Index, a measure of the Nation’s smallest publicly traded firms, returned -1.04% over the week. As developed, international equity performance and emerging markets were lower returning -0.64% and -0.86%, respectively. Finally, the 10-year U.S. Treasury yield moved higher, closing the week at 3.46%.
In the week following the Federal Open Market Committee’s (FOMC) tenth consecutive interest rate hike, market participants were interested in several economic reports that were used to gauge the effect that higher interest rates were having on the overall economy’s performance. The reports included inflation-related data (Consumer Price Index on Wednesday and Producer Price Index on Thursday), employment figures, and consumer sentiment. Investors were also following the movements in Washington, D.C., concerning the ongoing negotiations to raise the national debt ceiling limit.
The Consumer Price Index (CPI) increased by 4.9% in April compared to a year ago, representing the smallest annual result since April 2021 and slightly less than the consensus estimate of 5.0%. The decline recorded in April was the 10th consecutive month of declines. The day after CPI was reported, the Producer Price Index (PPI) also showed results that were viewed as less inflationary. For April, the PPI increased 0.2%, below the consensus estimate of 0.3%. On an annual basis, headline PPI increased just 2.3%, down from 2.7% in March and the lowest reading since January 2021. While declining, it should be noted that inflation remains well above the Federal Reserve target of 2.0%.
On Thursday, the market gathered more data suggesting that the Fed’s restrictive monetary policy was slowing the overall economy. Weekly jobless claims for the week ended May 6 jumped to 264,000, a rise of 22,000 from the prior week. Notably, this was the highest result since October 30, 2021.
Friday saw the release of the May preliminary report for the Michigan Consumer Sentiment Index. This monthly survey conducted by the University of Michigan measures consumer confidence levels about the economy, personal finances, business conditions, and buying conditions. The reading of 57.7 represented a decline of 9.1% from April’s final reading. Consumer sentiment is a key measure that we analyze carefully, given that consumer spending, which is impacted by consumer sentiment, accounts for approximately 70% of the Nation’s total Gross Domestic Product.
Throughout the week, elected officials in Washington, D.C., were engaged in a debate about increasing the Nation’s debt ceiling. The Tuesday meeting between the President and the leaders of the Senate and the House of Representatives showed no breakthrough in finding a solution to the current log jam. If past debt ceiling negotiations are a good approximation of the likely outcome to the current situation, there will be a deal made at the last minute that will avoid a fiscal disaster and leave both sides somewhat frustrated with the outcome. According to the U.S. Department of the Treasury, since 1960, Congress has acted 78 separate times to permanently raise, temporarily extend or revise the definition of the debt limit.
Investors should consider all the information discussed within this market update and many other factors when managing their investment portfolios. However, with so much data and so little time to digest, we encourage investors to work with experienced financial professionals to help process all this information to build and manage the asset allocations within their portfolios consistent with their objectives, timeframe, and tolerance for risk.
Best wishes for the week ahead!
Consumer Price Index and Producer Price Index are sourced from the Bureau of Labor Statistics. Weekly Jobless Claims are sourced from the Labor Department. Michigan Consumer Sentiment Index is sourced from the University of Michigan. Equity Market, Fixed Income returns, and rates are from Bloomberg as of 5/12/23. Economic Calendar Data from Econoday as of 5/12/23. International developed markets are measured by the MSCI EAFE Index, emerging markets are measured by the MSCI EM Index, and U.S. Large Caps are defined by the S&P 500 Index. Sector performance is measured using the GICS methodology.
Disclosures: Past performance does not guarantee future results. We have taken this information from sources that we believe to be reliable and accurate. Hennion and Walsh cannot guarantee the accuracy of said information and cannot be held liable. You cannot invest directly in an index. Diversification can help mitigate the risk and volatility in your portfolio but does not ensure a profit or guarantee against a loss.


