Last Week’s Markets in Review: What Does Recent Economic Data Tell Investors?

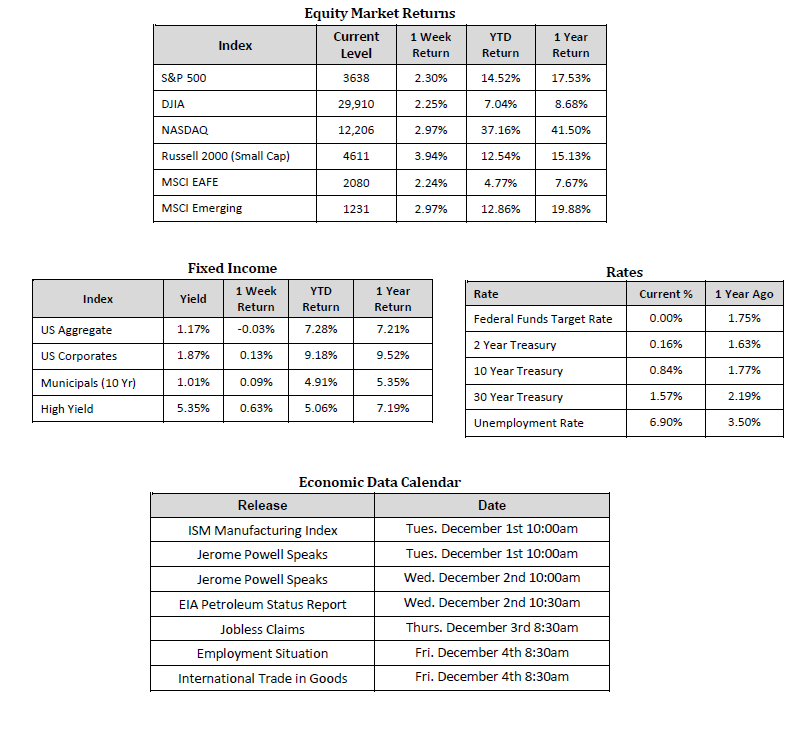
Investors gave thanks during the Thanksgiving holiday week as equities rose across the globe. In the U.S., the S&P 500 Index rose to a level of 3,638, representing a gain of 2.30%, while the Russell Midcap Index moved 2.60% higher last week. Meanwhile, the Russell 2000 Index, a measure of the Nation’s smallest publicly traded firms, increased 3.94% over the week. International equities also fared well as developed and emerging markets returned 2.24% and 1.79%, respectively. Finally, the yield on the 10-year U.S. Treasury moved very little, finishing the week at 0.84%, up 1 basis points from the week prior.
The Dow Jones Industrial Average reached a milestone last week, crossing the 30,000 level and closing at 30,046 on November 24. Although the Dow may not represent a practical market barometer for most investors and asset managers due to the small number of constituents and unique weighting methodology, it is widely recognized by the American public as a proxy for the U.S. stock market in general. The record close comes less than four years after the index breached 20,000 while it took 19 years to move from 10,000 to 20,000. The index is now up 63% since its March low for 2020 and is on track for its best month since 1987.
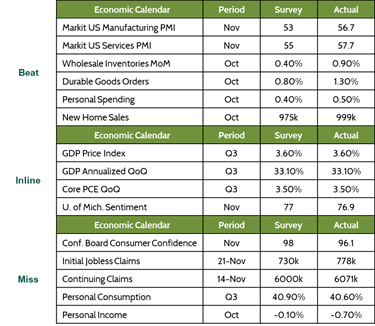
During the holiday-shortened week, we did, in fact, have a slew of economic releases to parse through. While you may still be digesting from what was hopefully an enjoyable and relaxing last few days, we’ll keep our update succinct. Below is a summary of what we believe are some of the more notable data points from last week.

Source: Bloomberg
While each figure holds a certain level of significance for economic/market implications, there were two “beats” and two “misses” that caught our attention. The first is durable goods orders. The manufacturing sector is a significant component of the economy and an important leading indicator of economic activity that provides insight into the supply chain’s status. The results from this month’s reading, which represents October activity, shows that the sector is recovering at a healthy pace and is supportive of the overall economic recovery. Next, on the “beat” side is manufacturing and services PMI. The Purchasing Managers’ Index (PMI) is a monthly survey of private sector senior executives that also helps provide insight into the economy’s overall well-being. Both readings exceeded expectations by a healthy margin and show encouraging economic activity expansion.
On the flip side, key readings on consumer confidence and jobs disappointed last week. U.S. consumer confidence fell to a three-month low. It is likely that the recent surge in COVID-19 cases across the country, and the related potential implications, have struck consumers with the harsh memories of lockdown-related hardships faced earlier in the year. Finally, initial jobless claims, as well as continuing claims, we’re higher than expected. While we balance COVID-19 cases with the stock market recovery, it is important for investors to appreciate that the scales could potentially tip unfavorably, based on the timing of approved vaccine distribution and the passage of the next relief bill out of Washington DC. As a result, some periods of short-term volatility through the end of the year would not be surprising, especially if economic data falls more sluggish.
Accordingly, we continue to encourage investors to stay disciplined and work with experienced financial professionals to help manage their portfolios through various market cycles within an appropriately diversified framework that is consistent with their objectives, time-frame, and risk tolerance.
Happy (belated) Thanksgiving again to all!
Sources for data in tables: Equity Market and Fixed Income returns are from JP Morgan as of 11/27/20. Rates and Economic Calendar Data from Bloomberg as of 11/27/20. International developed markets measured by the MSCI EAFE Index, emerging markets measured by the MSCI EM Index, U.S. Large Cap defined by the S&P 500. Sector performance is measured using the GICS methodology.
Diversification can help mitigate the risk and volatility in your portfolio but does not ensure a profit or guarantee against loss.
Investing in commodities is not suitable for all investors. Exposure to the commodities markets may subject an investment to greater share price volatility than an investment in traditional equity or debt securities. Investments in commodities may be affected by changes in overall market movements, commodity index volatility, changes in interest rates or factors affecting a particular industry or commodity.
Products that invest in commodities may employ more complex strategies which may expose investors to additional risks.
Investing in fixed income securities involves certain risks such as market risk if sold prior to maturity and credit risk especially if investing in high yield bonds, which have lower ratings and are subject to greater volatility. All fixed income investments may be worth less than the original cost upon redemption or maturity. Bond Prices fluctuate inversely to changes in interest rates. Therefore, a general rise in interest rates can result in the decline of the value of your investment.
Definitions
MSCI- EAFE: The Morgan Stanley Capital International Europe, Australasia and Far East Index, a free float-adjusted market capitalization index that is designed to measure developed-market equity performance, excluding the United States and Canada.
MSCI-Emerging Markets: The Morgan Stanley Capital International Emerging Market Index, is a free float-adjusted market capitalization index that is designed to measure the performance of global emerging markets of about 25 emerging economies.
Russell 3000: The Russell 3000 measures the performance of the 3000 largest US companies based on total market capitalization and represents about 98% of the investible US Equity market.
ML BOFA US Corp Mstr [Merill Lynch US Corporate Master]: The Merrill Lynch Corporate Master Market Index is a statistical composite tracking the performance of the entire US corporate bond market over time.
ML Muni Master [Merill Lynch US Corporate Master]: The Merrill Lynch Municipal Bond Master Index is a broad measure of the municipal fixed income market.
Investors cannot directly purchase any index.
LIBOR, London Interbank Offered Rate, is the rate of interest at which banks offer to lend money to one another in the wholesale money markets in London.
The Dow Jones Industrial Average is an unweighted index of 30 “blue-chip” industrial U.S. stocks.
The S&P Midcap 400 Index is a capitalization-weighted index measuring the performance of the mid-range sector of the U.S. stock market and represents approximately 7% of the total market value of U.S. equities. Companies in the Index fall between S&P 500 Index and the S&P SmallCap 600 Index in size: between $1-4 billion.
DJ Equity REIT Index represents all publicly traded real estate investment trusts in the Dow Jones U.S. stock universe classified as Equity REITs according to the S&P Dow Jones Indices REIT Industry Classification Hierarchy. These companies are REITs that primarily own and operate income-producing real estate.


