Last Week’s Markets in Review: What the Tech?

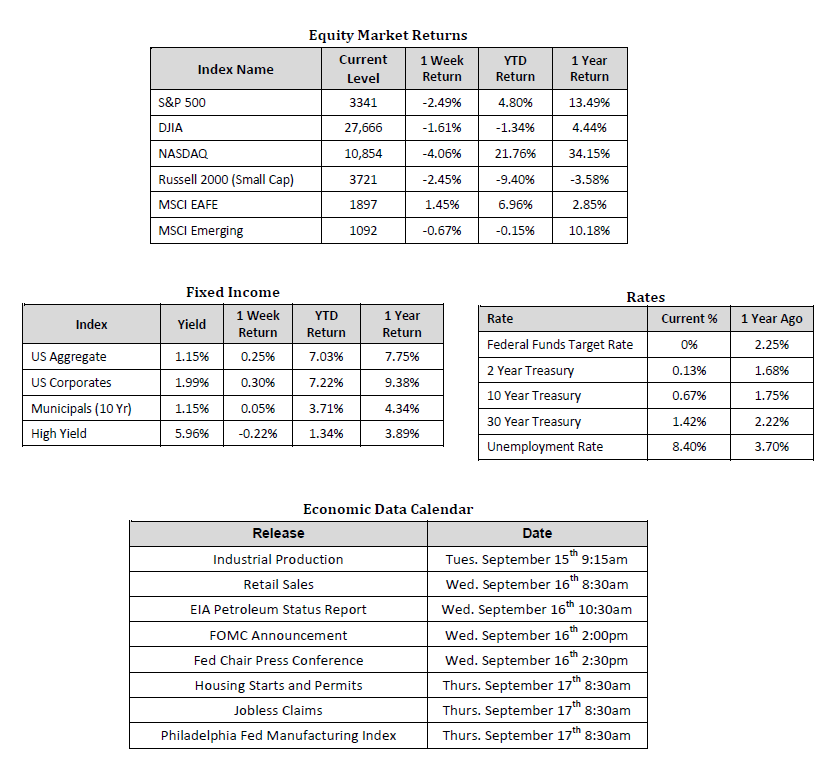
Stocks retreated for the second consecutive week led by large declines in the technology sector. In the U.S., the S&P 500 Index fell to a level of 3,341, representing a loss of 2.49%, while the Russell Midcap Index moved 1.98% lower last week. Meanwhile, the Russell 2000 Index, a measure of the Nation’s smallest publicly traded firms, returned -2.45% over the week. International equities we mixed across geographies as developed and emerging markets returned 1.45% and -0.67%, respectively. Finally, the yield on the 10-year U.S. Treasury declined, finishing the week at 0.67%, down five basis points from the week prior.
“Tech-pocalypse” – This may have been the most attention-grabbing headline we saw to describe the market selloff last week. However, we’re not in the business of just trying to collect headline “clicks,” so instead, we’ll attempt to put the recent market movements into perspective and offer guidance moving forward in this week’s update.
To start, what essentially took place during the time period of September 3 – September 8, 2020, was outsized selling pressure across the markets, with the technology sector absorbing the largest brunt of the selloff. What appeared to be potential profit-taking leading up to the holiday weekend extended into the following week.
During a global pandemic that has brought many companies within various industries to a grinding halt, the technology-laden NASDAQ Composite Index (“NASDAQ”) hit all-time highs and has increased 76% from trough to peak thus far in 2020. In fact, the Price-to-Earnings (P/E) ratio of the NASDAQ more than doubled its 10-year average P/E. While technology type companies have not been impacted as much as industries like transportation or hospitality during the COVID-19 pandemic, that’s still quite an epic ascent. Aside from policy support, including low-interest rates and stimulus measures, and the general optimism regarding improving economic conditions, there were a few other factors in play during this bull market run for technology stocks, including options.

Source: Bloomberg 9/10/20. Past performance is not an indication of future results.
What we have observed is that a large number of retail investors, and some large institutions, were active in call option purchases related to the high-flying technology stocks. Buying a call option gives an investor the right, but not the obligation, to purchase the underlying security at a set price. As a result, many option buyers believed that these stocks would rise further. However, one should realize that there is always a counterparty to that option trade, the call writer, who, in many cases, purchase the underlying stock involved in the option trade. These purchases drive prices higher. When positions unwind, or profits are taken, selling pressure hits the markets. As with other security types, options have their own unique set of risks and characteristics that should be thoroughly reviewed and understood before considering an investment.
It seems the tech sector has rebounded a bit since this recent selloff, perhaps by those looking to “buy the dips,” but the sector remains below previous highs. While we weren’t necessarily surprised by the selloff, the speed and magnitude were noteworthy. However, this does not mean that there are not growth opportunities ahead for the technology sector, as we believe that there are in certain areas of technology that are likely to be the leaders of the new American economy likely to emerge from the COVID-19 pandemic.
With overall stock market valuations still high, uncertainty surrounding additional stimulus, COVID-19 treatments, and of course the upcoming elections, we expect volatility to persist. As a result, we encourage investors to stay disciplined and work with experienced financial professionals to help manage their portfolios through various market cycles within an appropriately diversified framework that is consistent with their objectives, time-frame, and tolerance for risk.
We recognize that these are very troubling and uncertain times and we want you to know that we are always here for you to help in any way that we can. Please stay safe and stay well.
Sources for data in tables: Equity Market and Fixed Income returns are from JP Morgan as of 9/11/20. Rates and Economic Calendar Data from Bloomberg as of 9/11/20. International developed markets measured by the MSCI EAFE Index, emerging markets measured by the MSCI EM Index, U.S. Large Cap defined by the S&P 500. Sector performance is measured using GICS methodology.
Disclosures: Past performance does not guarantee future results. We have taken this information from sources that we believe to be reliable and accurate. Hennion and Walsh cannot guarantee the accuracy of said information and cannot be held liable. You cannot invest directly in an index.
Diversification can help mitigate the risk and volatility in your portfolio but does not ensure a profit or guarantee against loss.
Investing in commodities is not suitable for all investors. Exposure to the commodities markets may subject an investment to greater share price volatility than an investment in traditional equity or debt securities. Investments in commodities may be affected by changes in overall market movements, commodity index volatility, changes in interest rates or factors affecting a particular industry or commodity.
Products that invest in commodities may employ more complex strategies which may expose investors to additional risks.
Investing in fixed income securities involves certain risks such as market risk if sold prior to maturity and credit risk especially if investing in high yield bonds, which have lower ratings and are subject to greater volatility. All fixed income investments may be worth less than the original cost upon redemption or maturity. Bond Prices fluctuate inversely to changes in interest rates. Therefore, a general rise in interest rates can result in the decline of the value of your investment.
Definitions
MSCI- EAFE: The Morgan Stanley Capital International Europe, Australasia and Far East Index, a free float-adjusted market capitalization index that is designed to measure developed-market equity performance, excluding the United States and Canada.
MSCI-Emerging Markets: The Morgan Stanley Capital International Emerging Market Index, is a free float-adjusted market capitalization index that is designed to measure the performance of global emerging markets of about 25 emerging economies.
Russell 3000: The Russell 3000 measures the performance of the 3000 largest US companies based on total market capitalization and represents about 98% of the investible US Equity market.
ML BOFA US Corp Mstr [Merill Lynch US Corporate Master]: The Merrill Lynch Corporate Master Market Index is a statistical composite tracking the performance of the entire US corporate bond market over time.
ML Muni Master [Merill Lynch US Corporate Master]: The Merrill Lynch Municipal Bond Master Index is a broad measure of the municipal fixed income market.
Investors cannot directly purchase any index.
LIBOR, London Interbank Offered Rate, is the rate of interest at which banks offer to lend money to one another in the wholesale money markets in London.
The Dow Jones Industrial Average is an unweighted index of 30 “blue-chip” industrial U.S. stocks.
The S&P Midcap 400 Index is a capitalization-weighted index measuring the performance of the mid-range sector of the U.S. stock market and represents approximately 7% of the total market value of U.S. equities. Companies in the Index fall between S&P 500 Index and the S&P SmallCap 600 Index in size: between $1-4 billion.
DJ Equity REIT Index represents all publicly traded real estate investment trusts in the Dow Jones U.S. stock universe classified as Equity REITs according to the S&P Dow Jones Indices REIT Industry Classification Hierarchy. These companies are REITs that primarily own and operate income-producing real estate.


