Last Week’s Markets in Review: What to Make of Q1 Earnings and Economic Activity

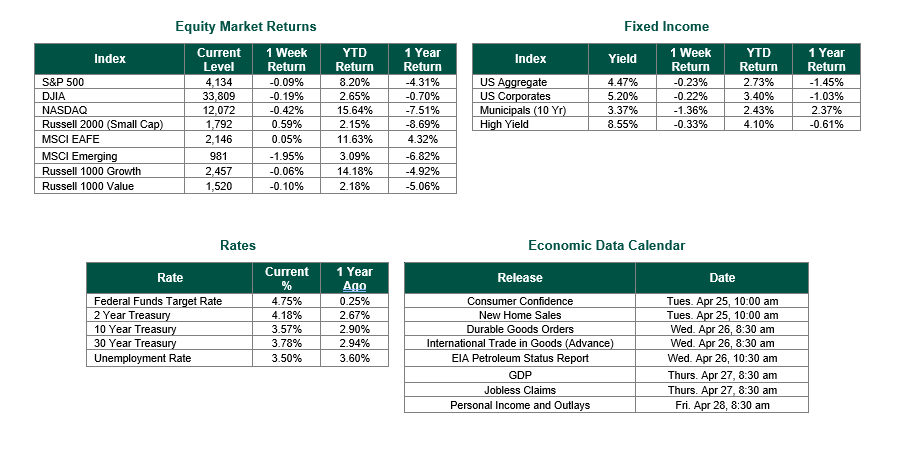
Global equity markets finished mixed for the week. In the U.S., the S&P 500 Index closed the week at a level of 4,134, representing a loss of 0.09%, while the Russell Midcap Index moved 0.21% higher last week. Meanwhile, the Russell 2000 Index, a measure of the Nation’s smallest publicly traded firms, returned 0.59% over the week. As developed, international equity performance and emerging markets were mixed, returning 0.05% and -1.95%, respectively. Finally, the 10-year U.S. Treasury yield moved higher, closing the week at 3.57%.
After being positive in 4 of the previous five weeks, the market would ultimately close in the red during a week heavily focused on the early stages of corporate earnings season. The early results would appear to not shake major indices despite the very modest red tickers this past week. As of the time of this update’s writing, approximately 18% of companies within the S&P 500 index reported their first-quarter earnings. According to FactSet, amongst those that have reported first-quarter results, nearly 61% outpaced their revenue expectations, and 76% beat their EPS estimates. However, the bar was not set very high for companies to beat on their sales and earnings results as analysts across most institutions had low expectations given the landscape of the current U.S. economy. In fact, according to Refinitiv, earnings for the S&P 500 index are on pace for a 4.7% year-over-year decline despite the “beating” figures that have so far been reported. Below are a few examples of the past week’s more positive releases.
• Tesla (Ticker: TSLA): Met expectations on earnings per share $0.85 vs. $0.85 expected, while beating on revenue $23.33 billion vs. $23.21 billion expected.
• Netflix (Ticker: NFLX): Beat on earnings per share of $2.88 vs. $2.86 expected, but missed on revenue of $8.16 billion vs. $8.18 billion expected.
• Proctor and Gamble (Ticker: PG): Beat on earnings per share of $1.37 vs. $1.32 expected, and beat on revenue of $20.07 billion vs. $19.32 billion expected.
• Bank of America (Ticker: BAC): Beat on earnings per share of $0.94 vs. $0.82 expected, and beat on revenue of $26.39 billion vs. $25.13 billion expected.
As for the U.S. economy, data suggested by the latest Flash PMI reading would indicate stronger-than-expected economic activity within the services and manufacturing sectors. The better-than-expected readings would give the PMI Composite Output Index the highest reading in 11 months. As of April 18, GDPNow from the Federal Reserve Bank of Atlanta estimates Q1 real gross domestic product (GDP) (seasonally adjusted annual rate) growth in the first quarter of 2023 to be 2.5%. However, the median projection of 18 Federal Reserve Open Market Committee (FOMC) members now calls for a 0.4% increase in U.S. GDP in 2023, suggesting potential declines in economic growth in the months and quarters ahead.
While recent data does appear relatively strong, headwinds still exist, and, likely, the economy has yet to experience the full impact of the historic number of interest rate hikes that took place over the last year. Next week, names such as Alphabet, Microsoft, Meta, and Amazon will release their earnings reports. The large, mega-cap stocks may paint a much different picture than what was witnessed this week.
Investors should consider all the information discussed within this market update and many other factors when managing their investment portfolios. However, with so much data and so little time to digest, we encourage investors to work with experienced financial professionals to help process all this information to build and manage the asset allocations within their portfolios consistent with their objectives, timeframe, and tolerance for risk.
Best wishes for the week ahead!
Earnings data from Bloomberg and Refinitiv on 4/21/23. PMI Composite Data from S&P Global on 4/21/23. Equity Market, Fixed Income returns, and rates are from Bloomberg as of 4/21/23. Economic Calendar Data from Econoday as of 4/7/23. International developed markets are measured by the MSCI EAFE Index, emerging markets are measured by the MSCI EM Index, and U.S. Large Caps are defined by the S&P 500 Index. Sector performance is measured using the GICS methodology.
Disclosures: Past performance does not guarantee future results. We have taken this information from sources that we believe to be reliable and accurate. Hennion and Walsh cannot guarantee the accuracy of said information and cannot be held liable. You cannot invest directly in an index. Diversification can help mitigate the risk and volatility in your portfolio but does not ensure a profit or guarantee against a loss.


