Last Week’s Markets in Review: What’s Performing Best Across the Globe in 2021?

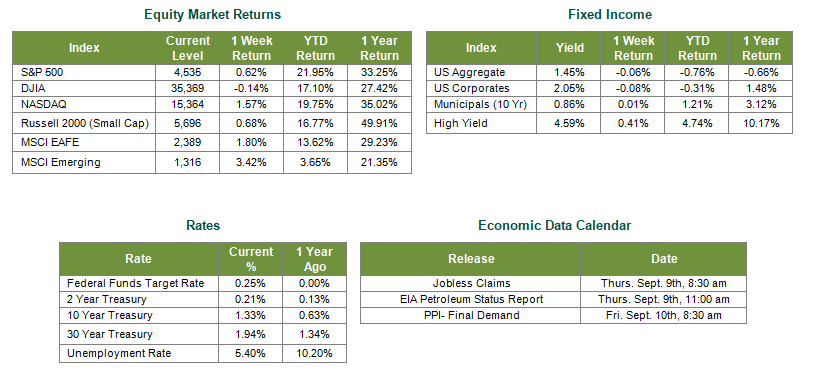
U.S. stock finished mostly higher last week with the S&P 500 and Dow setting new record highs. The S&P 500 Index closed the week at a level of 4,535, representing a gain of 0.62%, while the Russell Midcap Index moved 0.43% higher. Meanwhile, the Russell 2000 Index, a measure of the Nation’s smallest publicly traded firms, returned 0.68% over the week. International equity performance was positive as developed and emerging markets returned 1.80% and 3.42%, respectively. Finally, the 10-year U.S. Treasury yield was little changed over the week, closing at 1.33% on Friday.
Last week we closed the books on August, a fitting time to recap where equity markets stand year-to-date (YTD). To do so, we’ll delve into the three potential rotation trades within equity markets that we’ve been tracking throughout 2021. As a reminder, the rotations are U.S. to international, growth to value and large-cap to small-cap stocks.
Our analysis aims to provide investors insights into the contribution to total return of various geographies, market capitalizations, and styles. In the sections below, we will state the headline returns of the aforementioned rotations through the end of August and take a deeper look into what’s driving performance.
U.S. to International Potential Rotation
• U.S. Stocks (S&P 500 Index): 21.6%
• International Developed Markets (MSCI EAFE Index): 12.02%
• International Emerging Markets (MSCI Emerging Markets Index): 2.92%
On the surface, international markets don’t have a leg to stand on compared to the strength of U.S. stocks in 2021. However, the cap-weighted indexes used to track global market performance don’t necessarily tell the whole story of the underlying individual economies. As you can see in the table below, we review the performance of the top five regions by index weight for developed and emerging markets.

In developed markets, the index is heavily weighted to Japanese stocks, a region that has struggled with issues around the current health crisis. In contrast, the European markets listed have turned in stronger performances this year. These regions continue to recover and also have higher vaccination rates compared to the U.S. These countries, including Japan, are in the earlier stages of the economic expansion cycle, are attractively valued, and are structurally positioned to benefit from increased business activity in a global economic recovery.
In emerging economies, coming off a strong 2020 campaign, it’s clear that the growth concerns and regulatory measures that stifled Chinese stocks have been a drag on overall index performance, as China represents 32% of the emerging market index. In fact, excluding China, the index is up 11% YTD. We are bullish on China over the longer term but recognize potentially stronger prospects in other emerging economies in the short-term as their respective vaccination rates converge closer to their developed counterparts. While we still see growth potential in U.S. stock markets ahead, we are not dismissing this rotation and believe certain international markets deserve consideration.
Growth to Value & Large Cap to Small-Cap Potential Rotations
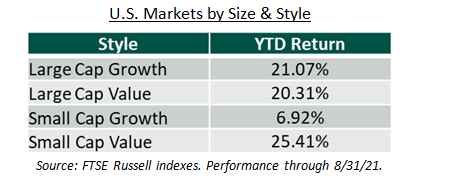
• U.S. Large-Cap Growth Stocks (Russell 1000 Growth Index): 21.1%
• U.S. Large-Cap Value Stocks (Russell 1000 Value Index): 20.3%
• U.S. Large-Cap (Russell 1000 Index): 20.7%
• U.S. Small-Cap (Russell 2000 Index): 15.8%

.
We decided to analyze the final two U.S.-based potential rotations together. Growth and value are neck and neck when it comes to large cap companies. Value came out of the gates strong this year, aided by reopening enthusiasm and depressed valuations. However, growth came storming back as the delta variant of COVID-19 prompted doubts over economic growth. Interest rates retreated, easing valuation pressures on certain growth companies with high price/earning (P/E) ratios. While this race is too close to call for large-cap stocks and too many factors remain uncertain that could tip the scales, the more exciting dynamics lie in the small-cap space. Small-cap stocks, as a whole, are lagging large and even mid-cap stocks. However, small-cap value is the best performing size/style mix while small-cap growth is the worst year-to-date (YTD) in 2021. Looking ahead, in our view, more upside potential exists for small-cap stocks as they have historically performed relatively well during periods of economic expansion and are currently undervalued on both a current and forward P/E basis.
We believe our research demonstrates the importance of understanding global markets and economies on a deeper level than what broad-based indexes show. Passive investing, without being part of a carefully constructed overall asset allocation strategy, can often lead to unwanted or unintended exposure to certain market segments. As a result, we encourage investors to work with experienced financial professionals to help build and manage asset allocations within their portfolios consistent with their objectives, timeframe, and tolerance for risk. Best wishes for the week ahead!
Sources for data in tables: Equity Market and Fixed Income returns are from JP Morgan as of 9/3/21. Rates and Economic Calendar Data from Bloomberg as of 9/3/21. International developed markets measured by the MSCI EAFE Index, emerging markets measured by the MSCI EM Index, U.S. Large Cap defined by the S&P 500. Sector performance is measured using the GICS methodology.
Disclosures: Past performance does not guarantee future results. We have taken this information from sources that we believe to be reliable and accurate. Hennion and Walsh cannot guarantee the accuracy of said information and cannot be held liable. You cannot invest directly in an index. Diversification can help mitigate the risk and volatility in your portfolio but does not ensure a profit or guarantee against a loss.
Diversification can help mitigate the risk and volatility in your portfolio but does not ensure a profit or guarantee against loss.
Investing in commodities is not suitable for all investors. Exposure to the commodities markets may subject an investment to greater share price volatility than an investment in traditional equity or debt securities. Investments in commodities may be affected by changes in overall market movements, commodity index volatility, changes in interest rates or factors affecting a particular industry or commodity.
Products that invest in commodities may employ more complex strategies which may expose investors to additional risks.
Investing in fixed income securities involves certain risks such as market risk if sold prior to maturity and credit risk especially if investing in high yield bonds, which have lower ratings and are subject to greater volatility. All fixed income investments may be worth less than the original cost upon redemption or maturity. Bond Prices fluctuate inversely to changes in interest rates. Therefore, a general rise in interest rates can result in the decline of the value of your investment.
Definitions
MSCI- EAFE: The Morgan Stanley Capital International Europe, Australasia and Far East Index, a free float-adjusted market capitalization index that is designed to measure developed-market equity performance, excluding the United States and Canada.
MSCI-Emerging Markets: The Morgan Stanley Capital International Emerging Market Index, is a free float-adjusted market capitalization index that is designed to measure the performance of global emerging markets of about 25 emerging economies.
Russell 3000: The Russell 3000 measures the performance of the 3000 largest US companies based on total market capitalization and represents about 98% of the investible US Equity market.
ML BOFA US Corp Mstr [Merill Lynch US Corporate Master]: The Merrill Lynch Corporate Master Market Index is a statistical composite tracking the performance of the entire US corporate bond market over time.
ML Muni Master [Merill Lynch US Corporate Master]: The Merrill Lynch Municipal Bond Master Index is a broad measure of the municipal fixed income market.
Investors cannot directly purchase any index.
LIBOR, London Interbank Offered Rate, is the rate of interest at which banks offer to lend money to one another in the wholesale money markets in London.
The Dow Jones Industrial Average is an unweighted index of 30 “blue-chip” industrial U.S. stocks.
The S&P Midcap 400 Index is a capitalization-weighted index measuring the performance of the mid-range sector of the U.S. stock market, and represents approximately 7% of the total market value of U.S. equities. Companies in the Index fall between S&P 500 Index and the S&P SmallCap 600 Index in size: between $1-4 billion.
DJ Equity REIT Index represents all publicly traded real estate investment trusts in the Dow Jones U.S. stock universe classified as Equity REITs according to the S&P Dow Jones Indices REIT Industry Classification Hierarchy. These companies are REITs that primarily own and operate income-producing real estate.


