Last Week’s Markets in Review: Where to Invest During an Economic Expansion
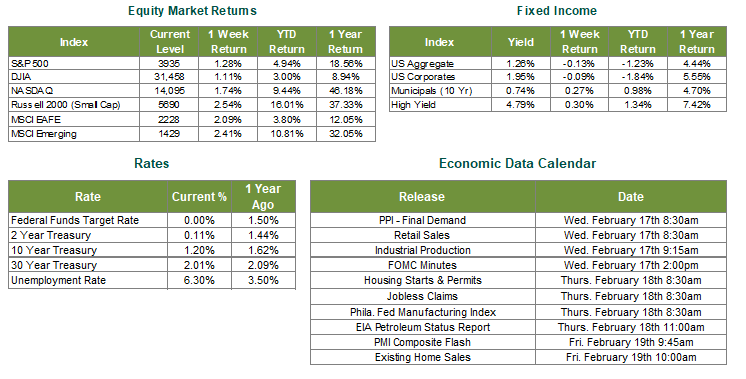
Global equity markets rallied again for the week, with U.S. equities trailing international equities. In the U.S., the S&P 500 Index rose to a level of 3,935, representing a 1.28% gain, while the Russell Midcap Index followed suit, rising 2.28%. Meanwhile, the Russell 2000 Index, a measure of the Nation’s smallest publicly traded firms, pushed 2.54% higher over the week. Moreover, developed and emerging international markets returned 2.09% and 2.41%, respectively. Finally, the 10-year U.S. Treasury moved to 1.20%, one basis point higher than the prior week.
Like a bear emerging from hibernation, the global economy is reawakening with vigor and energy following a relatively short but significant slumber in 2020. After a brief recessionary period in 2020 in which the U.S. economy contracted by 3.5%, a Bloomberg survey of 78 Wall Street economists indicates that the U.S. economy could expand by 4.7% in 2021. To put this 2021 Gross Domestic Product (GDP) growth forecast in context, consider that the average growth rate over the last 10 years has been 1.69%. We interpret expectations for growth in 2021 firmly above the 10-year average as one signal that we’re likely in the early stages of an economic expansion.
As such, we thought it would be useful to investigate which asset classes and stock market sectors have performed the best during previous periods of expansionary growth, particularly in the earliest stage of such a period. A recent research paper by Fidelity Investments titled, The Business Cycle Approach to Asset Allocation defines an early-cycle expansionary phase as “… a sharp recovery from recession, marked by an inflection from negative to positive growth in economic activity (e.g., gross domestic product, industrial production), then an accelerating growth rate. Credit conditions stop tightening amid easy monetary policy, creating a healthy environment for rapid margin expansion and profit growth. Business inventories are low, while sales growth improves significantly.”
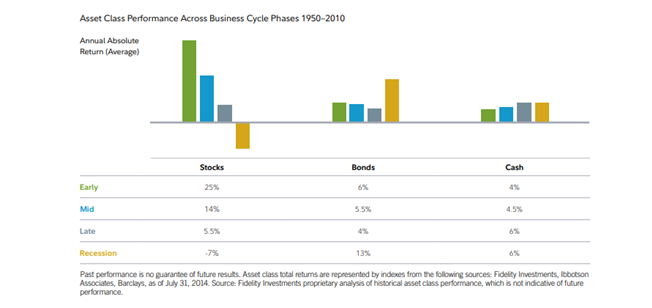
First, looking at asset class performance, we can see that stocks have historically outpaced bonds and cash during the early-cycle phase of an economic expansion. In fact, from 1950-2010, stocks produced an average annual return of 25% during the early-cycle phase, while bonds averaged 6% per year, and cash averaged 4% per year. The intuition here is relatively straightforward; above-average economic growth translates to above-average earnings per share growth, which is then reflected in a rapidly appreciating stock market. It’s also important to keep in mind that this phase of the economic cycle typically lasts about a year on average, which gives credence to the value of “time in the market”, and the potential perils of trying to “time the market”.
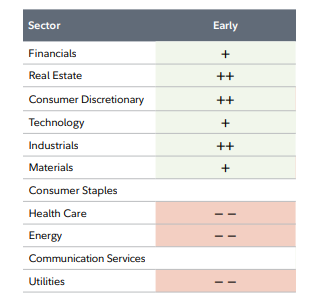
When we dive further into the equities asset class, we can see that a handful of GICS sectors have historically outperformed during the early-cycle phase of an economic expansion. Based on the same Fidelity Investments research report listed above, we can see that Real Estate, Consumer Discretionary, and Industrials have been the clear standouts, while Financials, Technology, and Materials have produced positive performance but not as convincingly as the three sectors previously mentioned. Conversely, Health Care, Energy, and Utilities have consistently produced poor performance, on average, during the early-cycle phase of an economic expansion. Move from early-cycle phase to the mid-cycle phase of an economic (which we may very be in the beginning stages of now), the sectors of Technology and Communication Services have historically provided the highest relative performance results.
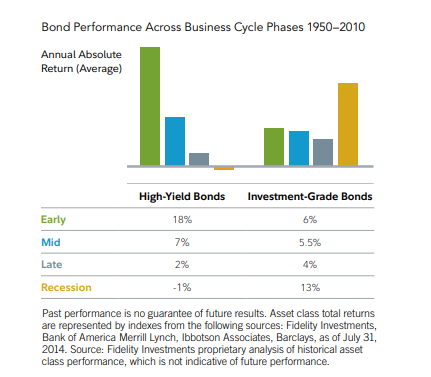
Turning to the fixed income asset class, it’s clear that high yield bonds convincingly outpace investment-grade bonds during the early phase of an economic expansion. One of the attractive characteristics many equity investors find in high yield bonds is the nearly 65% correlation they have to U.S. large cap stocks. The high correlation between these two assets at least partially explains why high yield bonds would rally alongside stocks. Let’s also not forget that high yield bonds are by definition riskier because they’re issued by corporations with lower credit ratings often due to concerns with their balance sheets. As the economic climate improves and activity picks up, investors assume that the balance sheets of high yield issuers will improve as well.
While certain asset class and sector tilts can be implemented to take advantage of those areas of the global capital markets that have historically produced strong returns during particular phases of the economic cycle, it’s important to remember that past performance is not indicative of future results and that most investor portfolios should be uniquely suited to their particular circumstances. As such, we continue to encourage investors to stay disciplined and work with experienced financial professionals to help build and manage the asset allocations within their portfolios consistent with their objectives, timeframe, and tolerance for risk.
Best wishes for the week ahead!
Disclosures: Past performance does not guarantee future results. We have taken this information from sources that we believe to be reliable and accurate. Hennion and Walsh cannot guarantee the accuracy of said information and cannot be held liable. You cannot invest directly in an index. Diversification can help mitigate the risk and volatility in your portfolio but does not ensure a profit or guarantee against a loss.
Other Data Sources: Equity Market and Fixed Income returns are from JP Morgan as of 2/12/20. Rates and Economic Calendar Data from Bloomberg as of 2/12/20. International developed markets measured by the MSCI EAFE Index, emerging markets measured by the MSCI EM Index, U.S. Large Cap defined by the S&P 500. Sector performance is measured using GICS methodology. S&P 500 sector performance represents total return figures sourced from Bloomberg.
Diversification can help mitigate the risk and volatility in your portfolio but does not ensure a profit or guarantee against loss.
Investing in commodities is not suitable for all investors. Exposure to the commodities markets may subject an investment to greater share price volatility than an investment in traditional equity or debt securities. Investments in commodities may be affected by changes in overall market movements, commodity index volatility, changes in interest rates or factors affecting a particular industry or commodity.
Products that invest in commodities may employ more complex strategies which may expose investors to additional risks.
Investing in fixed income securities involves certain risks such as market risk if sold prior to maturity and credit risk especially if investing in high yield bonds, which have lower ratings and are subject to greater volatility. All fixed income investments may be worth less than the original cost upon redemption or maturity. Bond Prices fluctuate inversely to changes in interest rates. Therefore, a general rise in interest rates can result in the decline of the value of your investment.
Definitions
MSCI- EAFE: The Morgan Stanley Capital International Europe, Australasia and Far East Index, a free float-adjusted market capitalization index that is designed to measure developed-market equity performance, excluding the United States and Canada.
MSCI-Emerging Markets: The Morgan Stanley Capital International Emerging Market Index, is a free float-adjusted market capitalization index that is designed to measure the performance of global emerging markets of about 25 emerging economies.
Russell 3000: The Russell 3000 measures the performance of the 3000 largest US companies based on total market capitalization and represents about 98% of the investible US Equity market.
ML BOFA US Corp Mstr [Merill Lynch US Corporate Master]: The Merrill Lynch Corporate Master Market Index is a statistical composite tracking the performance of the entire US corporate bond market over time.
ML Muni Master [Merill Lynch US Corporate Master]: The Merrill Lynch Municipal Bond Master Index is a broad measure of the municipal fixed income market.
Investors cannot directly purchase any index.
LIBOR, London Interbank Offered Rate, is the rate of interest at which banks offer to lend money to one another in the wholesale money markets in London.
The Dow Jones Industrial Average is an unweighted index of 30 “blue-chip” industrial U.S. stocks.
The S&P Midcap 400 Index is a capitalization-weighted index measuring the performance of the mid-range sector of the U.S. stock market and represents approximately 7% of the total market value of U.S. equities. Companies in the Index fall between S&P 500 Index and the S&P SmallCap 600 Index in size: between $1-4 billion.
DJ Equity REIT Index represents all publicly traded real estate investment trusts in the Dow Jones U.S. stock universe classified as Equity REITs according to the S&P Dow Jones Indices REIT Industry Classification Hierarchy. These companies are REITs that primarily own and operate income-producing real estate.