Last Week’s Markets in Review: Fed Raises Rates by Another 0.25%

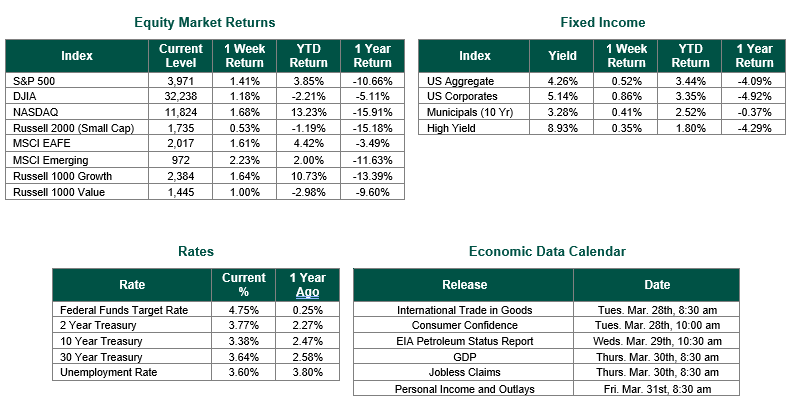
Global equity markets finished higher for the week. In the U.S., the S&P 500 Index closed the week at a level of 3,971, representing an increase of 1.41%, while the Russell Midcap Index moved 0.56% higher last week. Meanwhile, the Russell 2000 Index, a measure of the Nation’s smallest publicly traded firms, returned 0.53% over the week. As developed, international equity performance and emerging markets were higher returning 1.61% and 2.23%, respectively. Finally, the 10-year U.S. Treasury yield moved lower, closing the week at 3.38%.
With the recent turbulent markets, investors were hyper-focused on the results of the two-day FOMC meeting that took place on Tuesday and Wednesday of last week.
As widely anticipated, the Fed voted unanimously to raise rates by 25 Bp (0.25%) today. This action brings the Fed Funds Target Rate to a range of 4.75% – 5.00% (the upper bound of which essentially hits their earlier suggested terminal rate of 5%), the highest level since 2007. To put this into perspective, the Fed Funds Target Rate was within a range of 0.00% – 0.25% at the beginning of March 2022, meaning that the Fed has raised rates by 475 Bp over the last year.
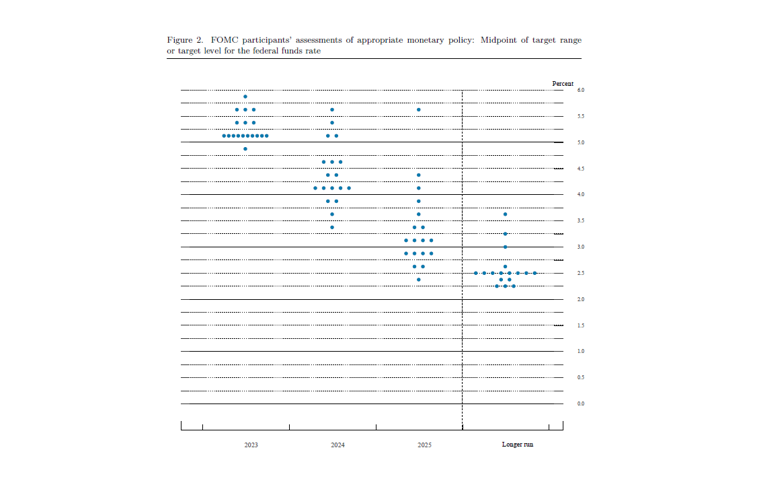
The Fed’s 2023 year-end median forecast for the Fed Funds Target Rate remained the same at 5.1%, suggesting that there may still be one more 25 Bp hike ahead this year – perhaps after their May meeting. Looking at the Fed’s updated Dot Plot Chart (see below), the majority of FOMC voting members (10 out of 18 members) expect only one more rate hike ahead by the end of this year. However, it should be noted that 8 of the 18 FOMC voting members forecast rates going slightly higher this year. One additional rate hike of 25 Bp would bring the Fed Funds Target Rate to a range of 5.00% – 5.25% (the lower bound of which essentially hits their earlier suggested terminal rate of 5%). None of the FOMC voting members currently forecast any rate cuts by the end of the year.

The Fed also increased their 2024 year-end forecast for the Fed Funds Target Rate to 4.3% from 4.1%, suggesting that rate cuts are still likely ahead in 2024. The Fed’s year-end inflation forecast, using PCE, moved slightly higher to 3.3% (Core PCE 3.6%) from 3.1% (Core PCE 3.5%) – still well above their 2% target. The Fed lowered their year-end unemployment forecast to 4.5% from 4.6% (still higher than the current unemployment rate of 3.6%). The Fed forecasts GDP growth of just 0.4% in 2023 and 1.2% in 2024.
We would also remind our readers that the Fed does not meet in April, with their next scheduled meeting taking place from May 2 – May 3. Our Capital Markets Update will continue to analyze future economic data that will affect FOMC policy for the remainder of 2023 and 2024.
Investors should consider all the information discussed within this market update and many other factors when managing their investment portfolios. However, with so much data and so little time to digest, we encourage investors to work with experienced financial professionals to help process all this information to build and manage the asset allocations within their portfolios consistent with their objectives, timeframe, and tolerance for risk.
Best wishes for the week ahead!
The FOMC Meeting results and data were sourced from the Federal Reserve. Equity Market, Fixed Income returns, and rates are from Bloomberg as of 3/24/23. Economic Calendar Data from Econoday as of 3/24/23. International developed markets are measured by the MSCI EAFE Index, emerging markets are measured by the MSCI EM Index, and U.S. Large Caps are defined by the S&P 500 Index. Sector performance is measured using the GICS methodology.
Disclosures: Past performance does not guarantee future results. We have taken this information from sources that we believe to be reliable and accurate. Hennion and Walsh cannot guarantee the accuracy of said information and cannot be held liable. You cannot invest directly in an index. Diversification can help mitigate the risk and volatility in your portfolio but does not ensure a profit or guarantee against a loss.


