Markets Weigh Energy Inflation Against Strong Earnings
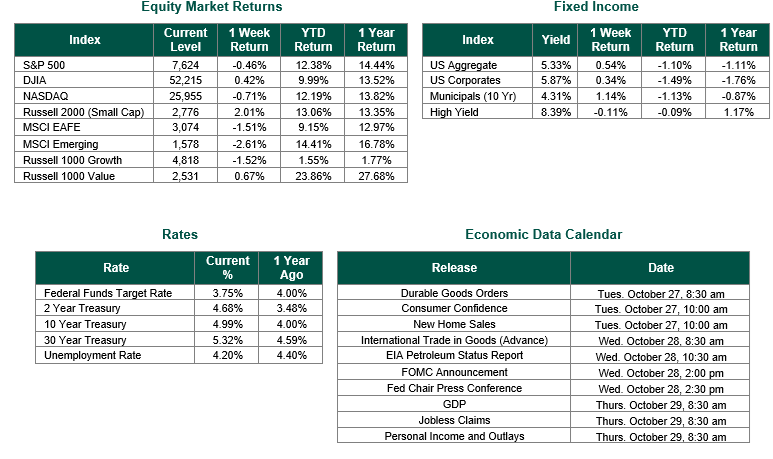
Global equity markets finished mixed for the week. In the U.S., the S&P 500 Index closed the week at a level of 7624, representing a decrease of 0.46%, while the Russell Midcap Index moved +0.92% last week. Meanwhile, the Russell 2000 Index, a measure of the Nation’s smallest publicly traded firms, returned +2.01% over the week. As developed international equity performance and emerging markets were negative, returning -1.51% and -2.61%, respectively. Finally, the 10-year U.S. Treasury yield moved lower, closing the week at 4.99%.
Elevated energy prices and evolving sector dynamics continue to reshape equity and fixed-income performance, even as a powerful corporate earnings season provides a strong fundamental backstop. Investors must now balance these immediate market crosscurrents against a crucial upcoming Federal Open Market Committee (FOMC) meeting.
Last week, global crude oil prices surged to six-month highs due to intensifying Middle East conflict, supply disruptions, and speculative trader positioning. International benchmark Brent crude jumped 6.2% for the week. Concurrently, the U.S. benchmark West Texas Intermediate (WTI) crude futures rose 2% over the course of the week.
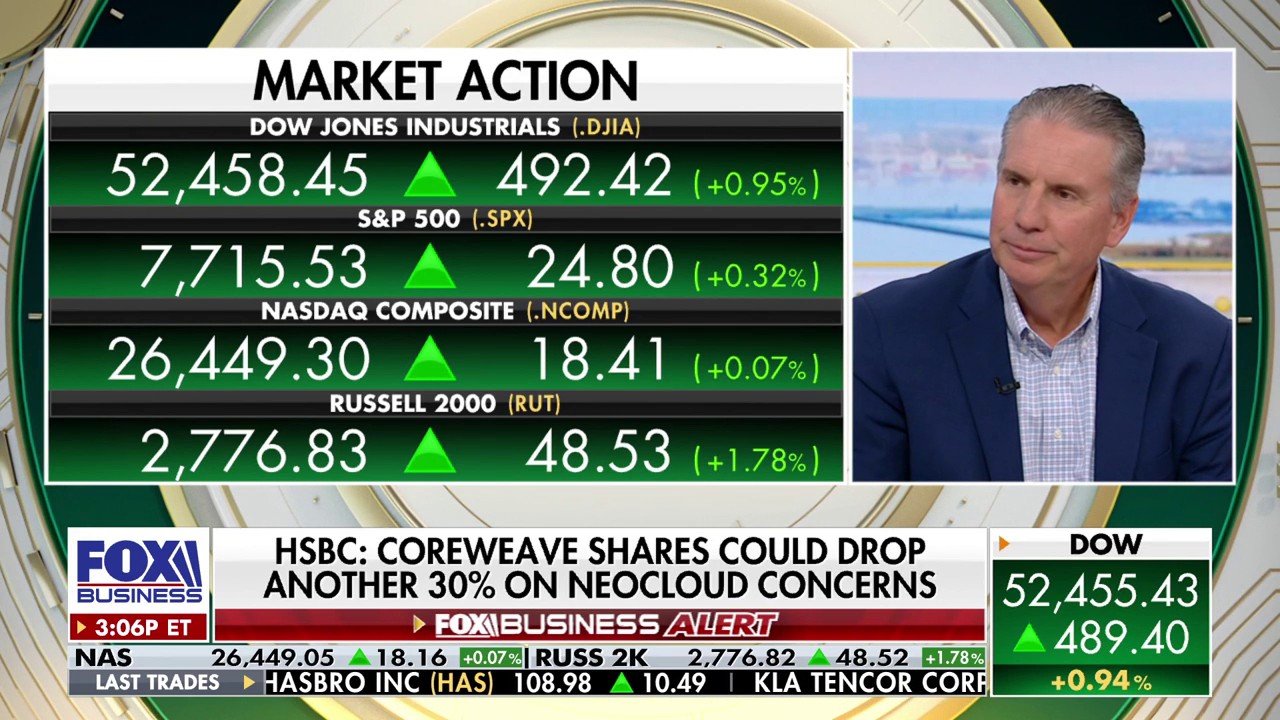
The escalation in energy prices kept major equity markets off-balance and heavily influenced the U.S. Treasury curve. In the stock market, fears of energy-driven inflation and “AI jitters” triggered a pronounced rotation away from the Tech sector. While the Dow Jones Industrial Average managed to close slightly higher, the tech-focused Nasdaq Composite and broader S&P 500 faced a more difficult week. Across fixed-income markets, the spike in crude oil directly stoked long-term inflation expectations, placing upward pressure on the U.S. Treasury curve. This sent the benchmark 10-year Treasury yield hovering near the critical 5.00% to 5.10% threshold earlier in the week before it settled just below the 5.00% mark.
According to FactSet, the S&P 500 is tracking for another robust corporate earnings season, with the current year-over-year earnings growth rate at 29.6%. This marks the third consecutive quarter of earnings growth exceeding 25% for the index. Revenue growth stands at 12.7%, tracking toward a third straight quarter of double-digit expansion, with all eleven sectors reporting top-line gains led by Information Technology, Energy, and Communication Services. Profit surprises remain historically sound: with approximately 24% of S&P 500 companies reporting to date, 83% have beaten EPS estimates, outperforming the five-year historical average. The upcoming week will be pivotal, with 179 S&P 500 companies scheduled to report, including Microsoft Corporation (MSFT), Alphabet Inc. (GOOG), Amazon.com, Inc. (AMZN), Eli Lilly (LLY), and Mastercard (MA).
Heading into the final stretch of 2026, the FOMC will meet for its October meeting this week. Following the Fed’s decision to lift the benchmark interest rate by 25 basis points in September to a target range of 3.75% to 4.00%, data from the CME FedWatch Tool indicates the most likely policy move for October is a temporary pause. Markets are pricing in an overwhelming 86.2% probability that the Fed will hold rates steady. However, this tightening cycle is widely expected to resume at the final meeting of the year. For the December session, FedWatch shows a significant shift in consensus, with an approximate 75% probability of another 25-basis-point hike, lifting the terminal federal funds rate to a target range of 4.00% to 4.25% by year-end to counteract sticky, energy-driven inflationary pressures.
Best wishes to all for the week ahead!
Equity and Fixed Income Index returns sourced from Bloomberg on 10/23/26. Corporate earnings data are sourced from FactSet. Future interest rate probabilities are sourced from CME Group FedWatch. International developed markets are measured by the MSCI EAFE Index, emerging markets are measured by the MSCI EM Index, and U.S. Large Caps are defined by the S&P 500 Index. Sector performance is measured using the GICS methodology.
Disclosures: Past performance does not guarantee future results. We have taken this information from sources that we believe to be reliable and accurate. Hennion and Walsh cannot guarantee the accuracy of said information and cannot be held liable. You cannot invest directly in an index. Diversification can help mitigate the risk and volatility in your portfolio, but does not ensure a profit or guarantee against a loss.