REITs Build on Second Half Rebound
Market Overview
Happening Now
Real Estate Investment Trusts (REITs) have continued to show signs of strength in Q3 after losing almost 5% over the first half of 2015. Concerns of rising interest rates have weighed on most dividend paying stocks this year as investors believe that there will be less of a demand for equity income after the Fed raises rates. We continue to believe that despite these concerns, the U.S. economy is not in a position for dramatic increases in interest rates and savers will continue to need to derive income for living expenses from equity investments. This should bode well for the future price performance of some dividend paying stocks, including equity REITs.
While interest rates, as measured by the 10 Year U.S. Treasury, fell from 2.35% on July 1 to the current level of 2.24% the consensus continues to be that the first hike in the Fed Funds Rate will occur at the September meeting. With the prospects of this upcoming Fed action likely priced into the current value of equity REITs, perhaps they are now trading based on their fundamentals, and less so on fears of what a 25bp hike in rates may do to investors’ appetite for equity income. Since hitting a year-to-date low on June 30th, REITs (as measured by the FTSE/NAREIT Real Estate 50 index) have rallied 5.8% and currently yield around 3.5%.
Given the strong historical performance of equity REITs during periods of economic growth, the asset class should benefit from the ongoing economic expansion in the U.S. To put this context, consider the time period of 2004 to 2006 when U.S. Real GDP was growing at an average rate of 2.85% per year. Over this time period, in an attempt to prevent the economy from overheating, the Fed raised rates 17 times. Equity REITs (using the Wilshire REIT index as a proxy) experienced an average annual return of 27.7% over the three year time period. While we do not expect this meteoric level of growth over the next three years, it makes a compelling case for equity REIT outperformance during periods of increasing economic activity and the subsequent increases in interest rates that it brings.
As a reminder, there are a variety of securities that fall under the REIT umbrella. The highest level of classification splits REITs into Equity or Mortgage with additional specification into the type of properties Equity REITs generate income from.
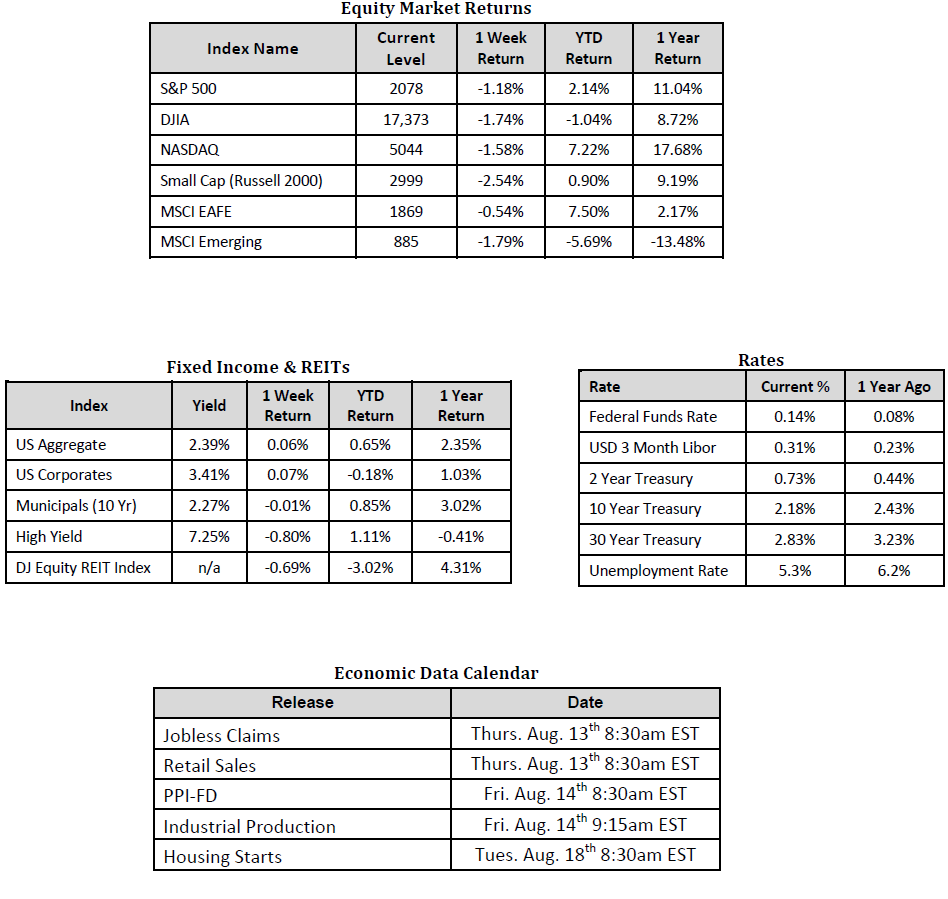
Sources: Equity Market, Fixed Income and REIT returns from JP Morgan as of 8/07/15. Rates and Economic Calendar Data from Bloomberg as of 8/10/15.
Important Information and Disclaimers
Disclosures: Past performance does not guarantee future results. We have taken this information from sources that we believe to be reliable and accurate. Hennion and Walsh cannot guarantee the accuracy of said information and cannot be held liable.
Investing in foreign securities presents certain risks not associated with domestic investments, such as currency fluctuation, political and economic instability, and different accounting standards. This may result in greater share price volatility. These risks are heightened in emerging markets.
There are special risks associated with an investment in real estate, including credit risk, interest rate fluctuations and the impact of varied economic conditions. Distributions from REIT investments are taxed at the owner’s tax bracket.
The prices of small company and mid cap stocks are generally more volatile than large company stocks. They often involve higher risks because smaller companies may lack the management expertise, financial resources, product diversification and competitive strengths to endure adverse economic conditions.
Investing in commodities is not suitable for all investors. Exposure to the commodities markets may subject an investment to greater share price volatility than an investment in traditional equity or debt securities. Investments in commodities may be affected by changes in overall market movements, commodity index volatility, changes in interest rates or factors affecting a particular industry or commodity.
Products that invest in commodities may employ more complex strategies which may expose investors to additional risks.
Investing in fixed income securities involves certain risks such as market risk if sold prior to maturity and credit risk especially if investing in high yield bonds, which have lower ratings and are subject to greater volatility. All fixed income investments may be worth less than original cost upon redemption or maturity. Bond Prices fluctuate inversely to changes in interest rates. Therefore, a general rise in interest rates can result in the decline of the value of your investment.
Definitions
MSCI- EAFE: The Morgan Stanley Capital International Europe, Australasia and Far East Index, a free float-adjusted market capitalization index that is designed to measure developed-market equity performance, excluding the United States and Canada.
MSCI-Emerging Markets: The Morgan Stanley Capital International Emerging Market Index, is a free float-adjusted market capitalization index that is designed to measure the performance of global emerging markets of about 25 emerging economies.
Russell 3000: The Russell 3000 measures the performance of the 3000 largest US companies based on total market capitalization and represents about 98% of the investible US Equity market.
ML BOFA US Corp Mstr [Merill Lynch US Corporate Master]: The Merrill Lynch Corporate Master Market Index is a statistical composite tracking the performance of the entire US corporate bond market over time.
ML Muni Master [Merill Lynch US Corporate Master]: The Merrill Lynch Municipal Bond Master Index is a broad measure of the municipal fixed income market.
Investors cannot directly purchase any index.
LIBOR, London Interbank Offered Rate, is the rate of interest at which banks offer to lend money to one another in the wholesale money markets in London.
The Dow Jones Industrial Average is an unweighted index of 30 “blue-chip” industrial U.S. stocks.
The S&P Midcap 400 Index is a capitalization-weighted index measuring the performance of the mid-range sector of the U.S. stock market, and represents approximately 7% of the total market value of U.S. equities. Companies in the Index fall between S&P 500 Index and the S&P SmallCap 600 Index in size: between $1-4 billion.
DJ Equity REIT Index represents all publicly traded real estate investment trusts in the Dow Jones U.S. stock universe classified as Equity REITs according to the S&P Dow Jones Indices REIT Industry Classification Hierarchy. These companies are REITSs that primarily own and operate income-producing real estate